


Do you have problems with slowdown in a workbook and want to know what the cause is? Or do you simply need to share it or publish it and want to assess performance duration in advance? With Tableau’s Performance Recording you can record and analyze the performance of key events that occur during interaction with the workbook, such as: query execution and compilation, geocoding, data source links, layout calculations, extract generation, blend data and server rendering (Tableau Server only). Performance Recording can be activated from Tableau Desktop or Tableau Server: let’s see both in detail.
Tableau Desktop Performance Recording
Open the workbook of interest and activate performance recording from the toolbar:
Help > Setting and Performance > Start a Performance Recording
Recording is active in the background. At this point you must interact with the workbook, and then stop recording:
Help > Setting and Performance > Stop a Performance Recording
A workbook consisting of two dashboards will be automatically generated: Performance Summary and Detailed Views. Within the Performance Summary there are three views:
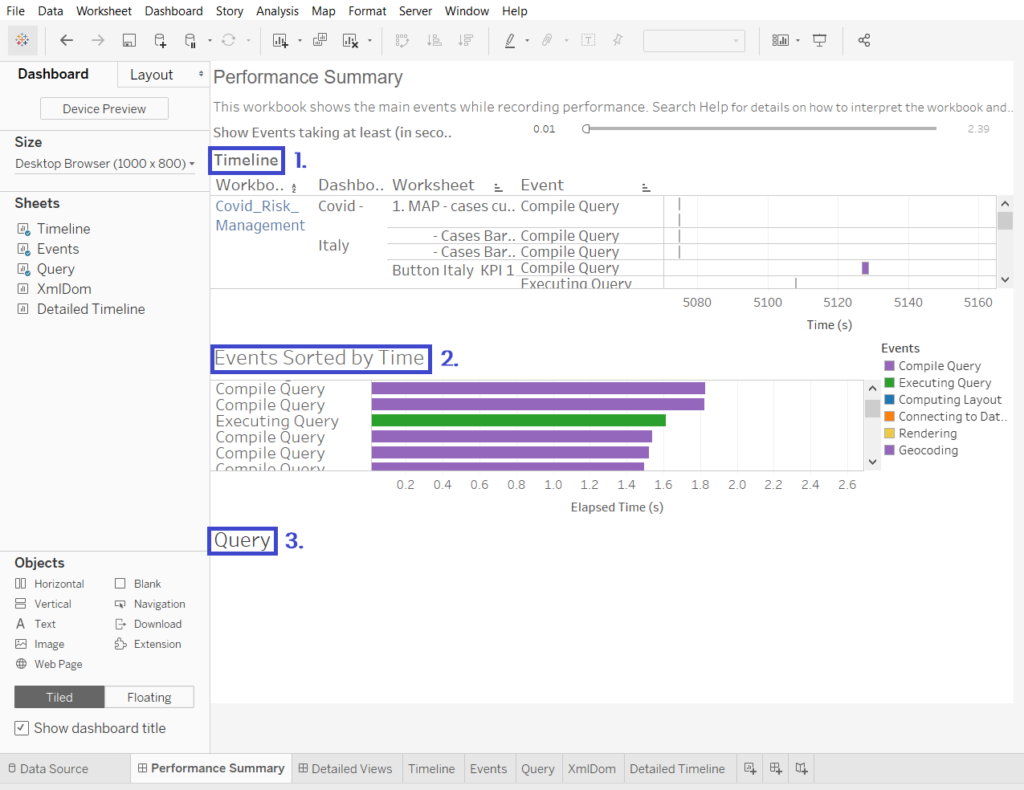
- The Timeline chronologically orders the events that occurred during the recording, showing their duration in seconds from the start of Tableau and their context (workbook, dashboard, worksheet).
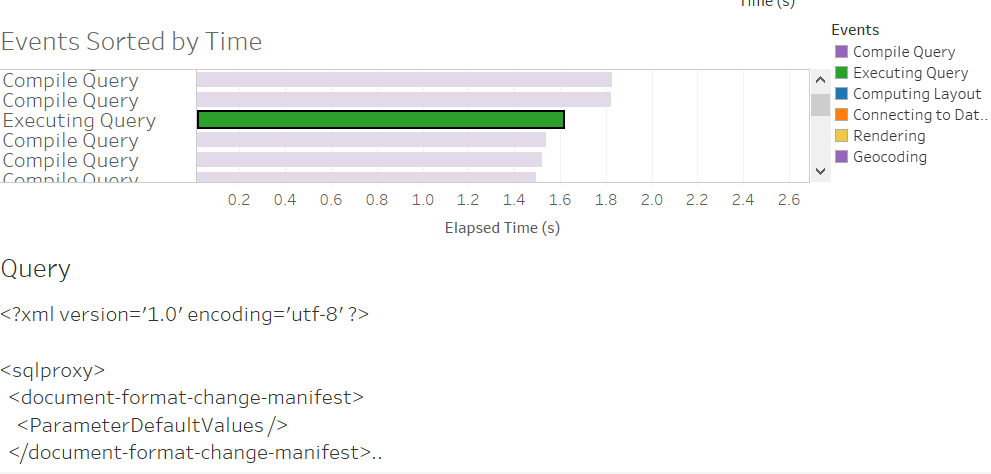
- Events orders events by duration in descending mode and sorts them by color according to type. In our case the Compile Query event has the longest duration: it could have been caused by the use of too many filters, complex calculations, Level Of Detail (LOD), nested calculations. For more details on the single events follow the link: https://help.tableau.com/current/pro/desktop/it-it/perf_record_create_desktop.htm#eventi
- In the third view, Query, you can see the XML code (in case of published datasource) or SQL code (in case of datasource directly linked to the data source) of the Executing Query event selected by view 1. or 2. If the query is truncated, you can check the Tableau logs saved on your PC, at Documents > My Tableau Repository > Logs
In the second dashboard, Detailed Views, typically intended for advanced users when designing workbooks, there are two more views:
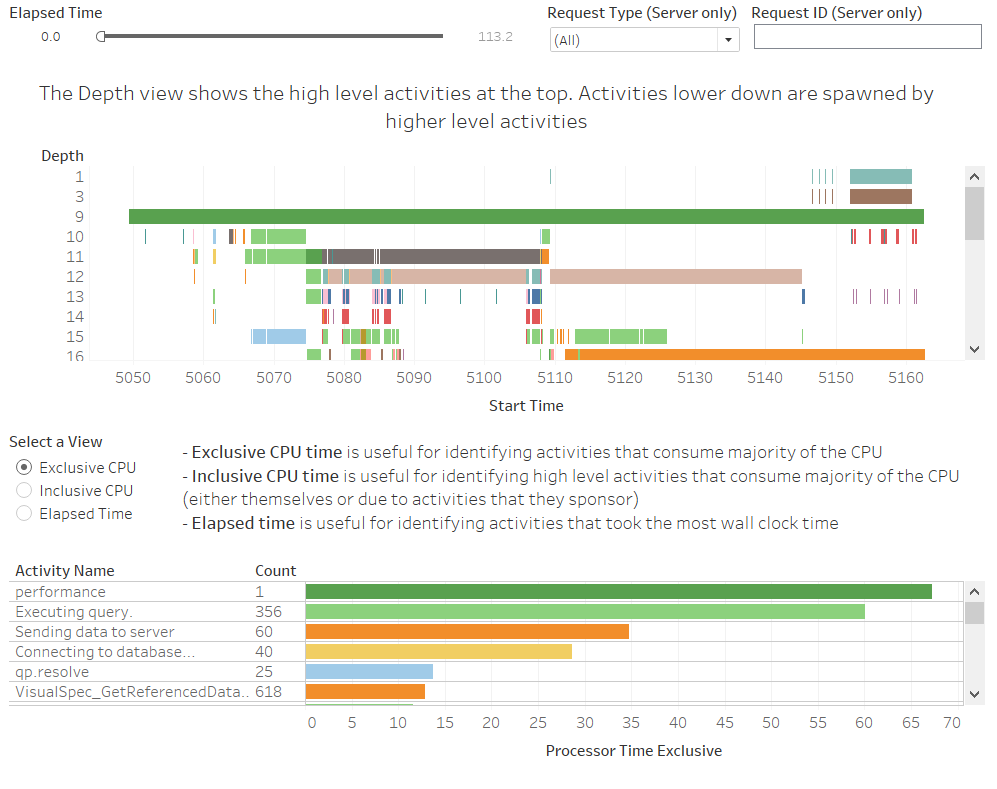
- At the top, the Depth view shows the high-level activities generated when a request is made by a user, such as editing a filter or loading a view. The length of the bars represents the duration of the activities. Through this view, you can quickly identify long-running activities.
- In the lower view we find the child activities, or low-level activities, with the count – that is, how many times the activity has been repeated – and the relative duration. With this view it is possible to discriminate the activities that are repeated several times, but that require little time.
There are also three interactive views of aggregated activity statistics: CPU exclusive, highest CPU consuming activities, CPU inclusive, high level activities with highest CPU consumption, time spent, highest duration activities.
Tableau Server Performance Recording
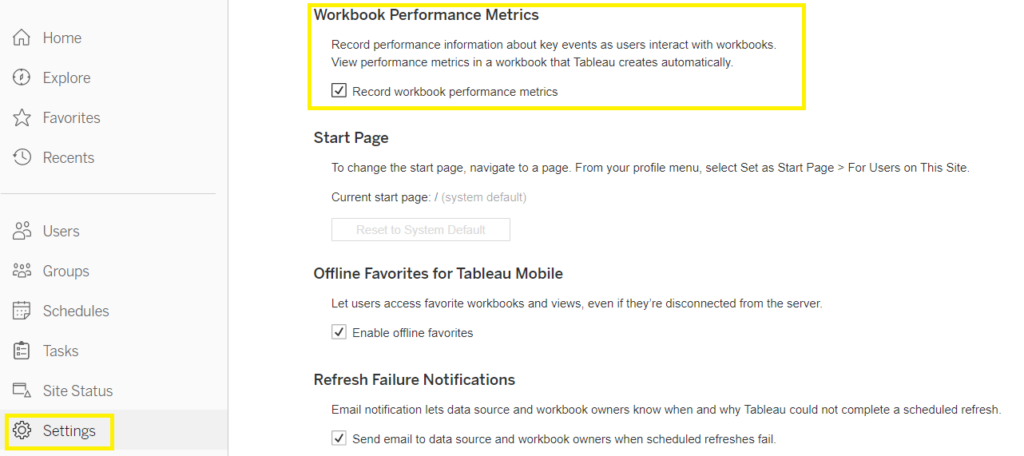
To enable the function from Server you need to be a server or site administrator. After that, the steps are as follows:
- In the settings, flag “Record Workbook Performance Metrics”.
- In another tab, open the dashboard of interest and edit the URL in the search bar as in the following example, adding the string :record_performance=yes& before the session iid: http://10.32.139.22/#/views/Coffee_Sales2013/USSalesMarginsByAreaCode?:record_performance=yes&:iid=1
- Refresh the workbook page: a clock will appear in the toolbar indicating that the recording is active. Clicking on the clock will stop the recording and generate the performance workbook.
![]()
NB:
In Tableau Server the Detailed Views dashboard is not available, only the Performance Summary.
To learn more about the world of Business Intelligence, visit the official Tableau page, keep following us on our blog and on our social channels Facebook and LinkedIn.