


Those who work in marketing, digital or otherwise, know it well: the amount of reporting done every day is immense and, very often, totally diverse. Analyzing sites and their performance, planning and buying media, creating and monitoring content, promoting the brand and developing brand awareness, analyzing the performance of each social campaign: these are just some of the responsibilities of those who work in the industry.
The risk of losing sight of some key statistics and values is real, and very often, data analysis alone takes up more time than you have available. In the past, every different traditional marketing activity (think TV and print) was analyzed in a single static report, which contained all the available data collected through surveys.
Nowadays, with the advent of digital communication channels that very often run in parallel with the “old” way of marketing, there is an inevitable need to create a more complete overview, to allow both the insiders and the end customer to have a clearer and more concise view of the big picture. How, then, to combine all this diverse data into a single, immediately usable analysis?
Tableau is a good answer to this question, especially for the digital marketing world.
How to use Tableau in digital marketing

We also talked about it in a previous article: to make data usable and accessible to everyone, we need to change our vision and Tableau is definitely the tool that best suits this process.
The ways in which you can use it to create high-performance, comprehensive dashboards are numerous, and they obviously adapt to the needs of the individual company. There are those who may want to delve into the trends and growth variations of a brand, to understand how different marketing activities have affected brand awareness or purchasing decisions.
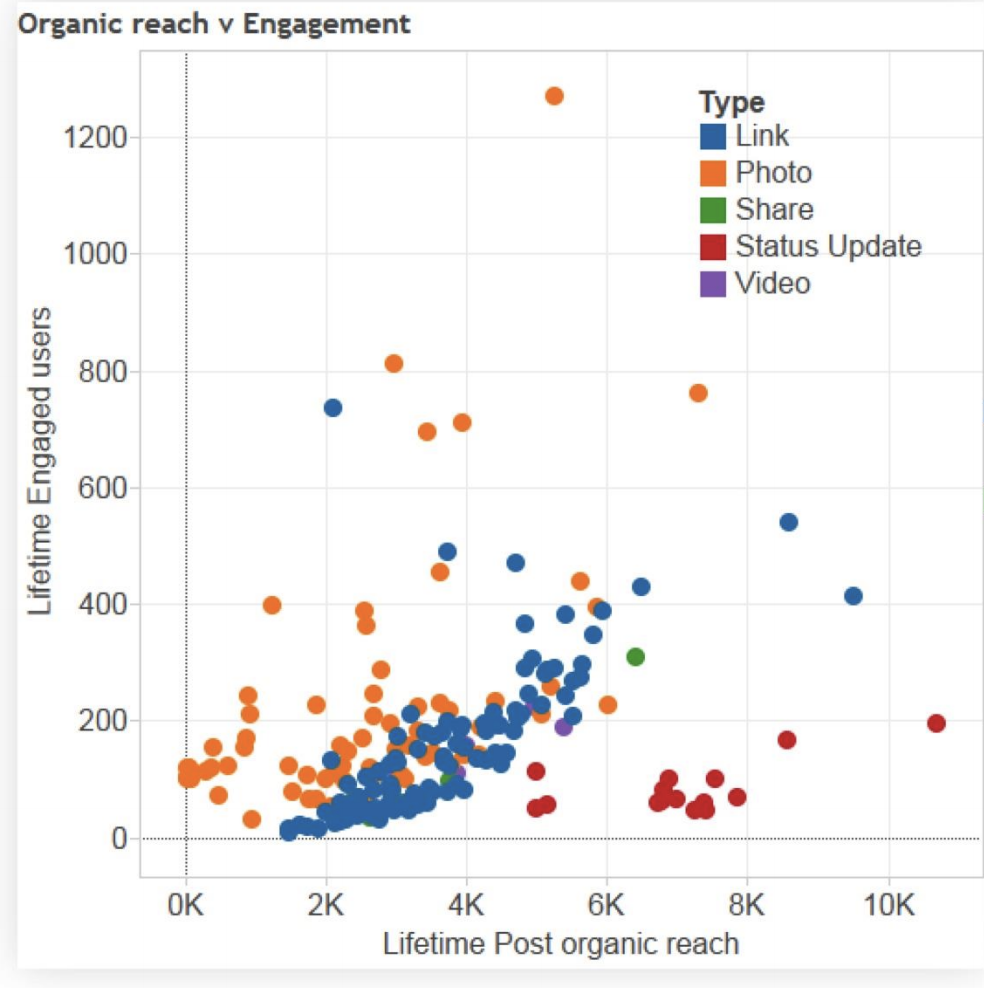
You may need to compare two or more measures, to compare their relationships, such as in a social post engagement analysis. In this case, a scatter plot might be the ideal solution.
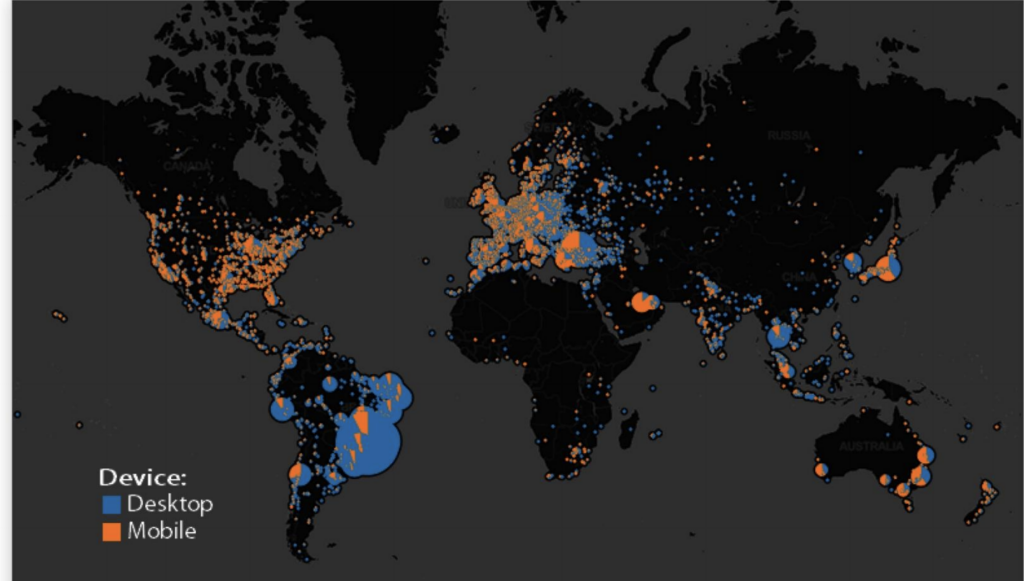
Or, again, you may need to analyze where followers or buyers are coming from geographically, to see in which regions or states to invest the most, or to identify which device to focus on to increase ROI.
There are many options available and it’s up to the marketer to identify the one that best suits their needs. In any case, to get more information on this topic, you can visit the official Tableau page or the Tableau Public section dedicated to Marketing Analysis, from which you can get interesting ideas for your dashboards.
Also continue to follow us on our blog and on our social channels Facebook and LinkedIn.