


Starting today, our new column dedicated to forecasting in Tableau Desktop. Did you know that it is possible to make real forecasts on our data? If the answer is no, we hope to provide you with an additional tool that can give more value to your analysis!
Our journey will touch on several topics: the models that Tableau implements by default, how to customize them, and how to implement other prediction models thanks to Tableau’s native integrations to Python and R.
Shaping the future with Tableau Desktop
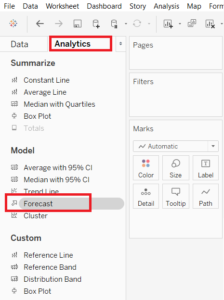
Forecasting is one of those topics that is often not addressed by the Tableau community. At the heart of this functionality are several models that can help analysts understand the evolution of their data over time.
Forecasting future values involves the analysis of so-called time-series using models called Exponential Smoothing.
The choice of the model to apply for the forecast varies depending on the data we want to analyze. Automatically, Tableau advises the user on the best model to apply, but this can be further customized based on certain parameters, which we will discuss later.
Exponential Smoothing models
At the base of Tableau forecasting we find the so-called Exponential Smoothing Models. These models predict the values of a time series from a weighted average, with exponentially increasing weights. In this way, recent observations will have greater weight than past values. According to the logic of this model, future values are the result of a general component summarizing past values and a specific contribution from more recent values.
Choose the right model for your data
In order to have a good forecast, we need to find a model that best explains the data in front of us. Without a good model, we will have a low quality forecast and the estimate made will not be accurate. Tableau automatically selects the best of several models, i.e., the one that can generate the highest quality forecast.
We can either let Tableau select the best configuration for the model or choose to customize it. If we take this second road, we will be able to specify the characteristics of trend and seasonality in independent way between them. With “trend” we refer to the tendency in the data to grow or decrease in time.

The seasonality is instead a variation that repeats itself in the time and that can be predicted.
On Tableau we can decide how to configure trend and seasonality by choosing between two model features: Additive and Multiplicative.
In the Additive model, the combined effect of several independent factors is the sum of the isolated effects of each factor. In other words, the contribution of the different components of the model is summed.
In contrast, in the Multiplicative model, the combined effect of several independent factors is the product of the isolated effects of each factor. In other words, the contribution of the different components of the model is multiplied. This model can improve forecast quality for data where trend and seasonality are affected by the amount of data available.
Which model is preferable?
The choice of the model to apply is a key element to consider in order to make accurate predictions. Tableau recommends us by default the best configuration to use for our analysis, but (as we will see better later) also allows us to customize the setting of the model to apply. One possible choice is to try applying different models, to see which one best suits the data we want to analyze.
Curious to learn more about forecasting in Tableau? Keep following us on our blog and on our social channels Facebook and LinkedIn and visit the official Tableau page!