


Here is the second installment of the column dedicated to Forecasting, or how to be able to forecast data using Tableau Desktop. In this series of articles, we will follow an iter, in which we will see which models Tableau implements by default, how to customize them and how to implement other forecasting models thanks to Tableau’s native integrations to Python and R.
Configure a Forecast on Tableau
A little while ago we told you about how forecasting works in Tableau (if you missed it, take a look here). Today, we’re going to explain how to configure Tableau’s forecast settings to refine our forecasts.
By default, Tableau recommends the best usable configuration; nevertheless, we can customize the forecasting based on some parameters. Now let’s see how to create a forecast in Tableau.
Create a forecast on Tableau
Generally, to create a forecast on Tableau we need at least one measure and one date field. Let’s take an example where we want to forecast future sales values. Using Superstore data, we drag in Order Date (month, continuous) and Sales.

Now, we can add a forecast in three ways:
- Right-click in the worksheet, then Forecast > Show Forecast
- Analysis Menu > Forecast > Show Forecast
- From the Analytics Pane, drag Forecast into the view

Configure the forecast
We can change the configuration of the forecast model by right-clicking on the worksheet, Forecast > Forecast Options.
Below we explain more about what each section of this menu indicates.
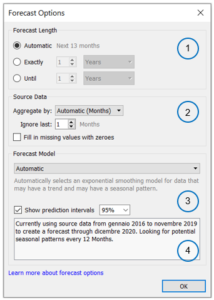
Forecast Options: Forecast Length
In this section we can choose the forecast extension. The choice can be determined by Tableau automatically, but can also be modified by the user, choosing between the number of specific units and a point in the future.
Forecast Options: Source Data
From this menu, the user can first choose the level of time granularity of the time series. Again, Tableau automatically determines the most appropriate level of aggregation (generally the same as shown in the visualization), but this can still be changed by the user. In addition, you can choose to exclude a certain period from the model estimate.
Forecast Options: Forecast Model
This section allows us to choose the model to use. As we have already seen in the previous article dedicated to forecasting, Tableau allows us to use an Additive and a Multiplicative model.
Forecast Options: Show Prediction Intervals
Finally, in this section we can configure the confidence interval for the model. Automatically, Tableau generates the forecast using a 95% confidence interval. This means that the forecast model has determined that with 95% probability the estimated values of the measurement will fall within that area, for that given period. Confidence intervals can then be configured to 90%, 95%, 99% or can be removed from the display.
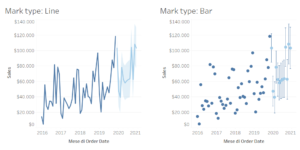
Depending on the type of mark used in the graph, the confidence interval may change type of representation:
- If we choose a line graph, the confidence interval will be shown as an area
- If we use Shape, Square, Circle, Bar or Pie as the mark type, the confidence interval will be shown with the whiskers of the typical box plot.
Once the forecasting model has been configured, we can share information about the model we have created and the characteristics we have set with all users: just right-click on the worksheet, Forecast > Describe Forecast. In the window that appears, Tableau provides summary information on the data we are modeling up to the declaration of the model itself. All this information can be copied (using the Copy to Clipboard button) and inserted into the dashboard.

To conclude
The forecast on Tableau is a very interesting functionality to have useful estimates on the evolution of our business. As we have seen, we can let Tableau decide which is the best configuration for our model, or we can decide ourselves the characteristics of the model to apply. In both cases, a preliminary and careful look at the data we want to analyze is essential.
To learn more about the world of Business Intelligence, visit the officialTableaupage, keep following us on our blog and on our social channels Facebook and LinkedIn.