


A bump chart is a special type of line graph. It is perfect for visualizing your data in ranks and easily compare performance and trends over time.
Let us then see how to build step-by-step bump chart on Tableau. Our goal is to create a graph showing sales per region from Sample Superstore data.
Step 1. Create the bump chart
- Connect to the data source Sample – Superstore.
- Drag Order date on Columns.
- Fit to Entire view.
- Drag Sales on Rows.
- Drag Region on Color in the Marks card.
- Right click on Sales in Rows and select Quick table calculation > Rank.
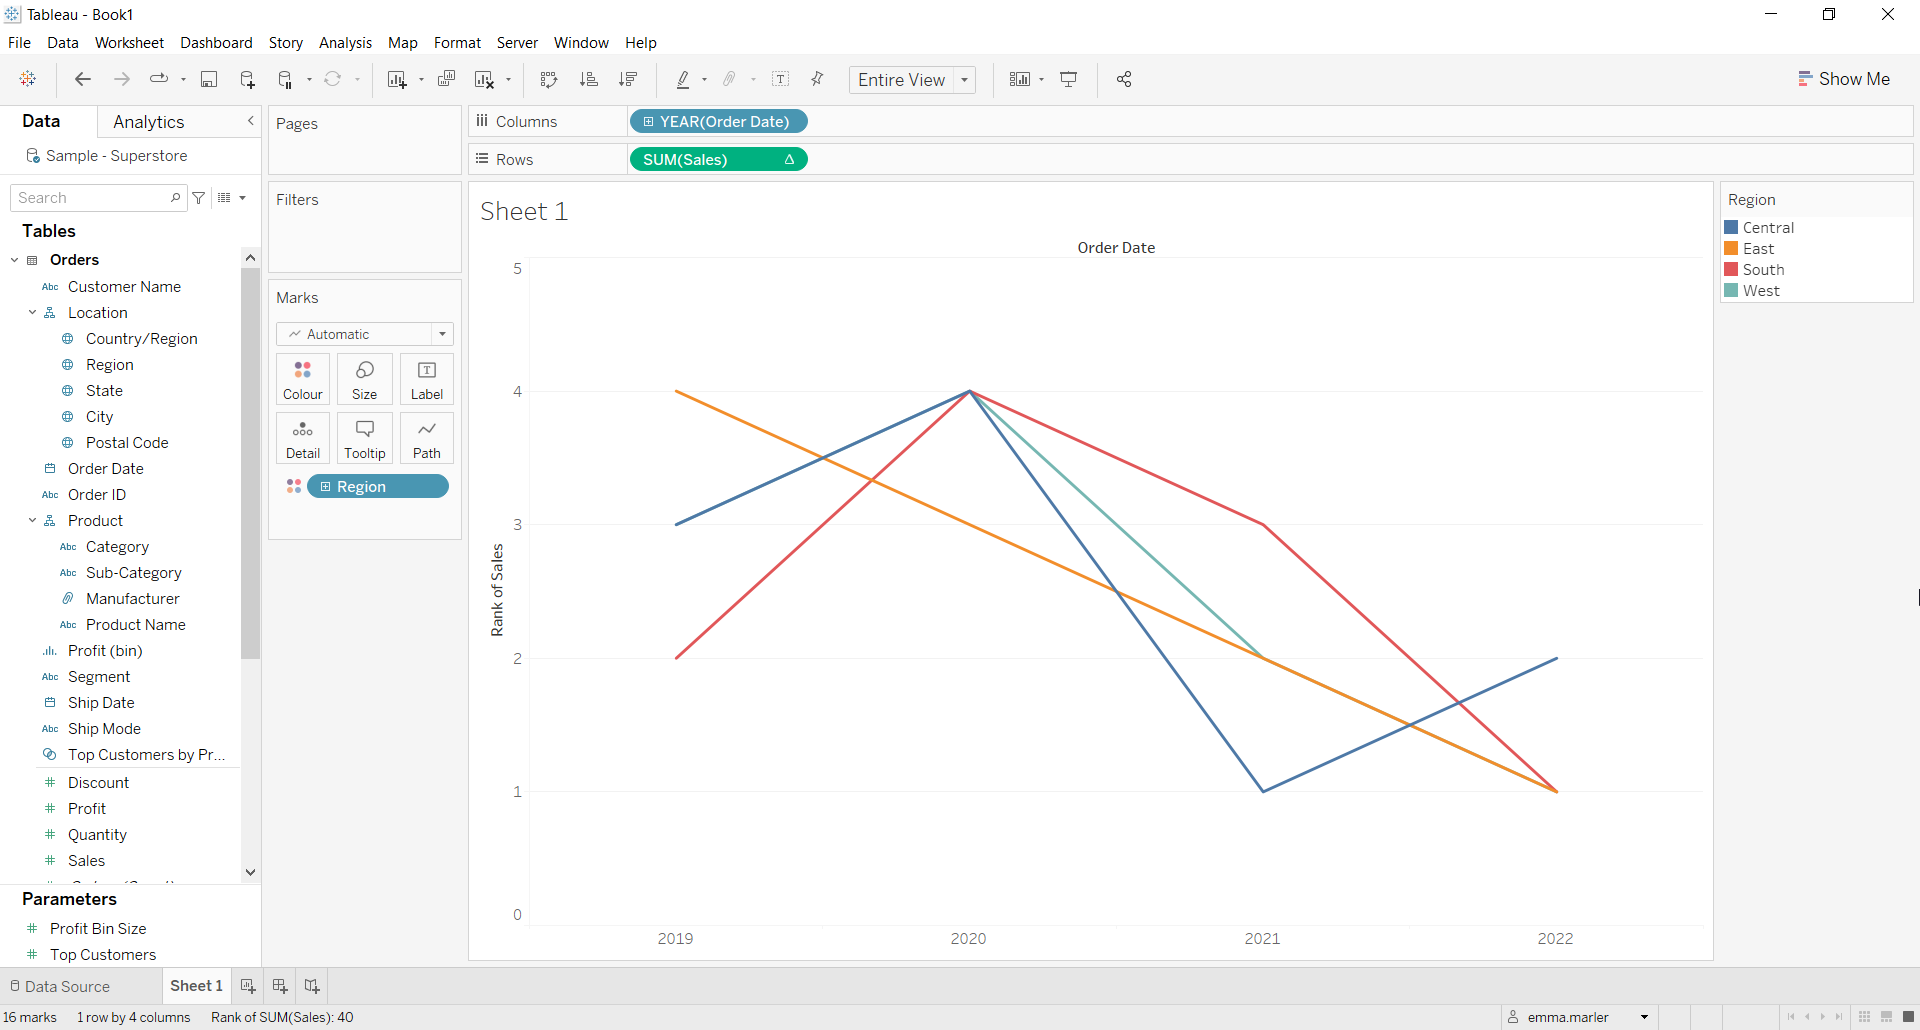
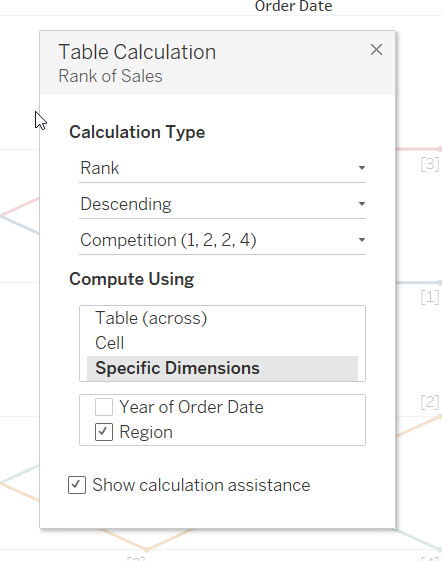
- Right click on Sales in Rows again and select Edit table calculation and modify the pop-up window as shown below.
- Adjust the size from Size in the Marks card.
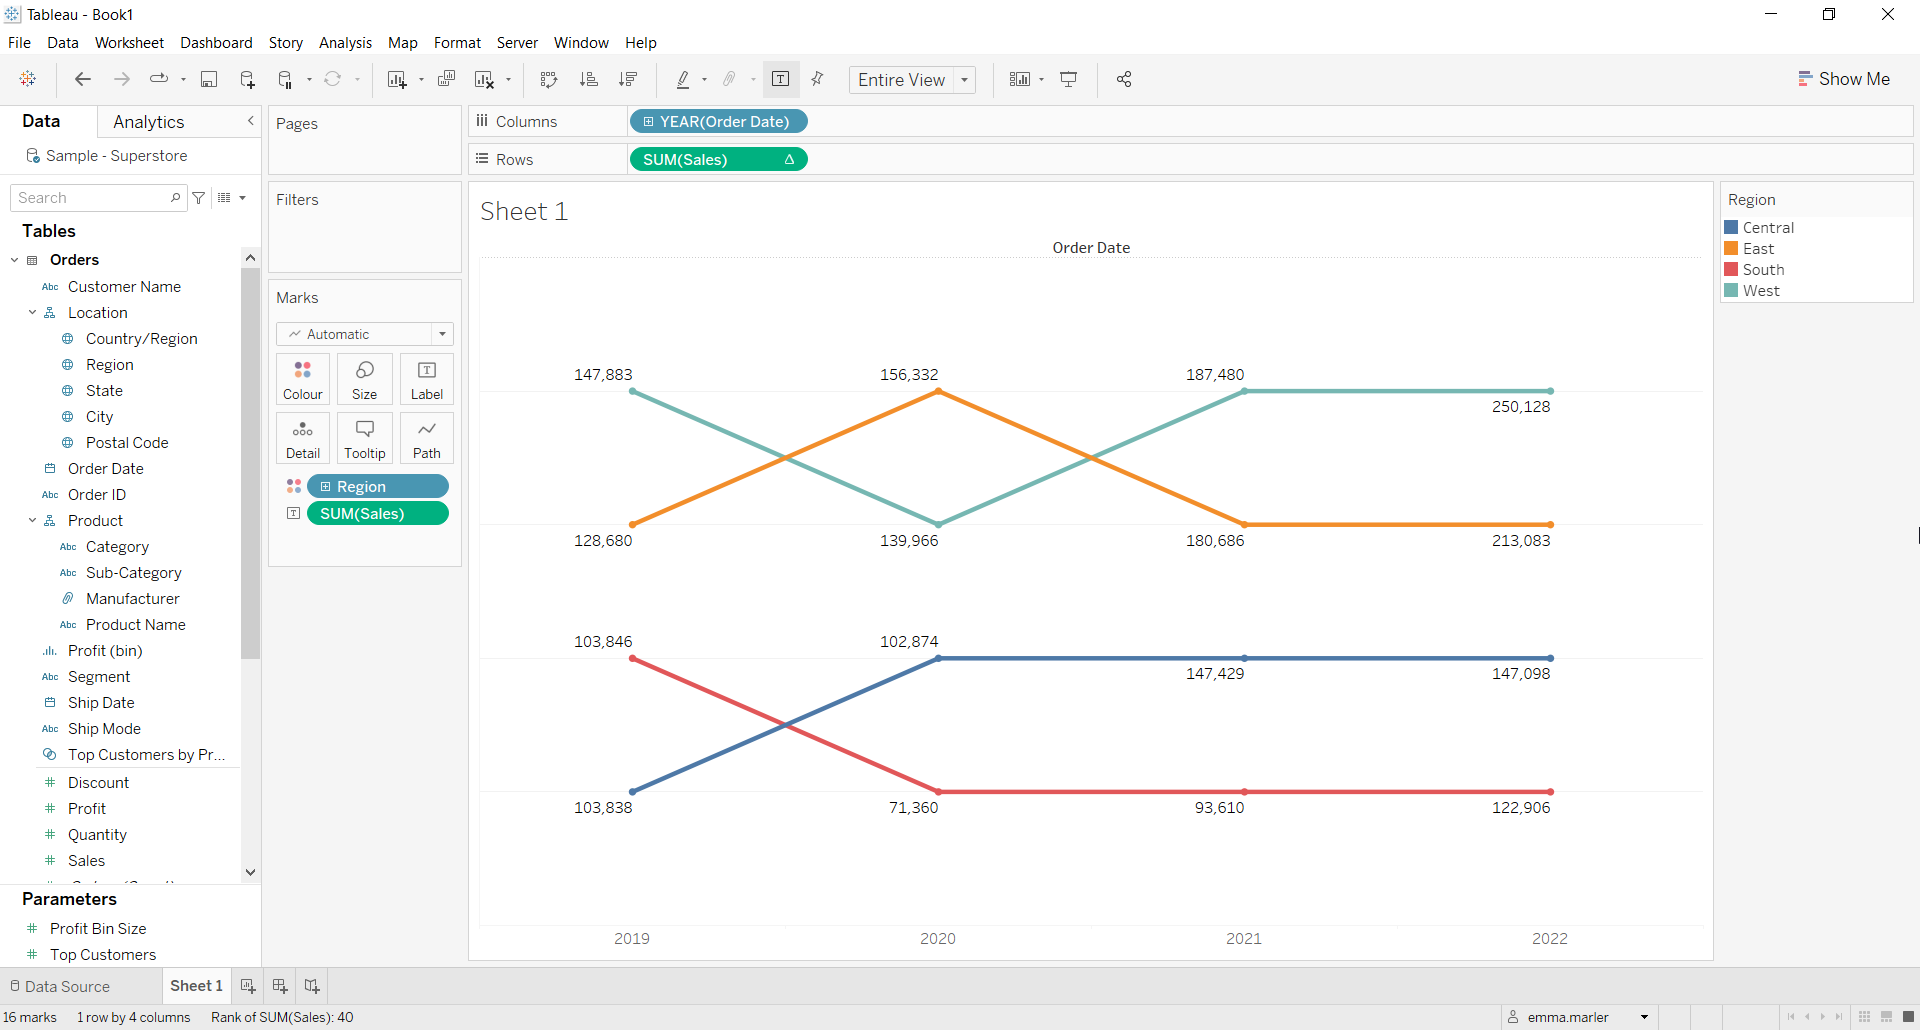
- Drag Sales on Label in the Marks card.
- Right click on the y-axis and select Edit axis > Scale > Reversed.
- Right click on the y-axis again and selecct Show Header to hide it. Done!
Don’t wait! Contact us to learn more and continue to follow upcoming news on our website and LinkedIn channel.