


For several versions now, Tableau Desktop provides some tools to predict how the data we are analyzing will behave. We are talking about the Forecast options which we have already discussed in depth in two different articles (part 1 and part 2).
With the arrival of the new version 2020.3, Tableau has introduced new features in the predictive analysis. In response to requests from the community, Tableau will include new features that can be used in the calculated fields: MODEL_PERCENTILE and MODEL_QUANTILE.
These functions generate Table Calculations which increase the degree of flexibility with which forecasts can be carried out, allowing analyses to be recalculated on the basis of the data displayed and therefore operating on hierarchies, filters, parameters, selected marks and LOD.
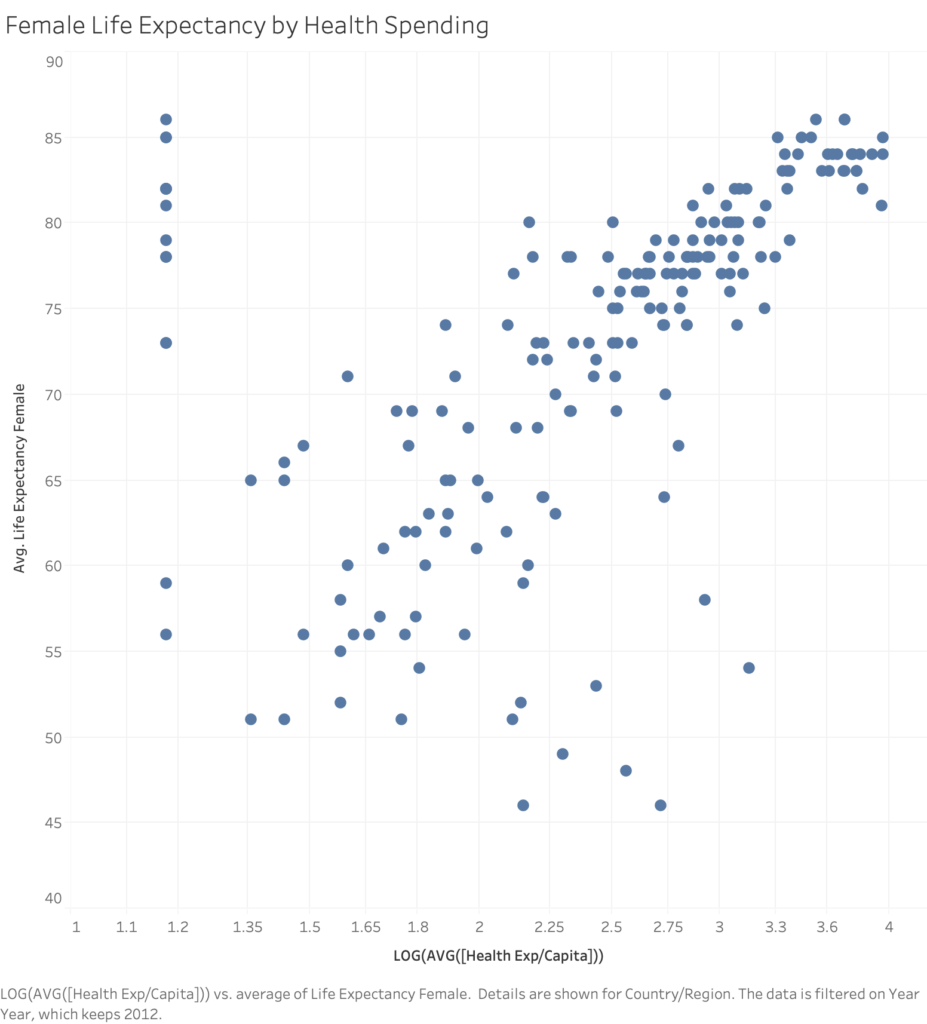
Let’s make some examples using the World Indicators datasource, present in the Tableau Desktop installation. In order to obtain more appropriate distributions, for the purposes of the example we will operate logarithmic transformations.
We begin with a visualization comparing each country’s health care spending to women’s life expectancy, filtered for the year 2012.
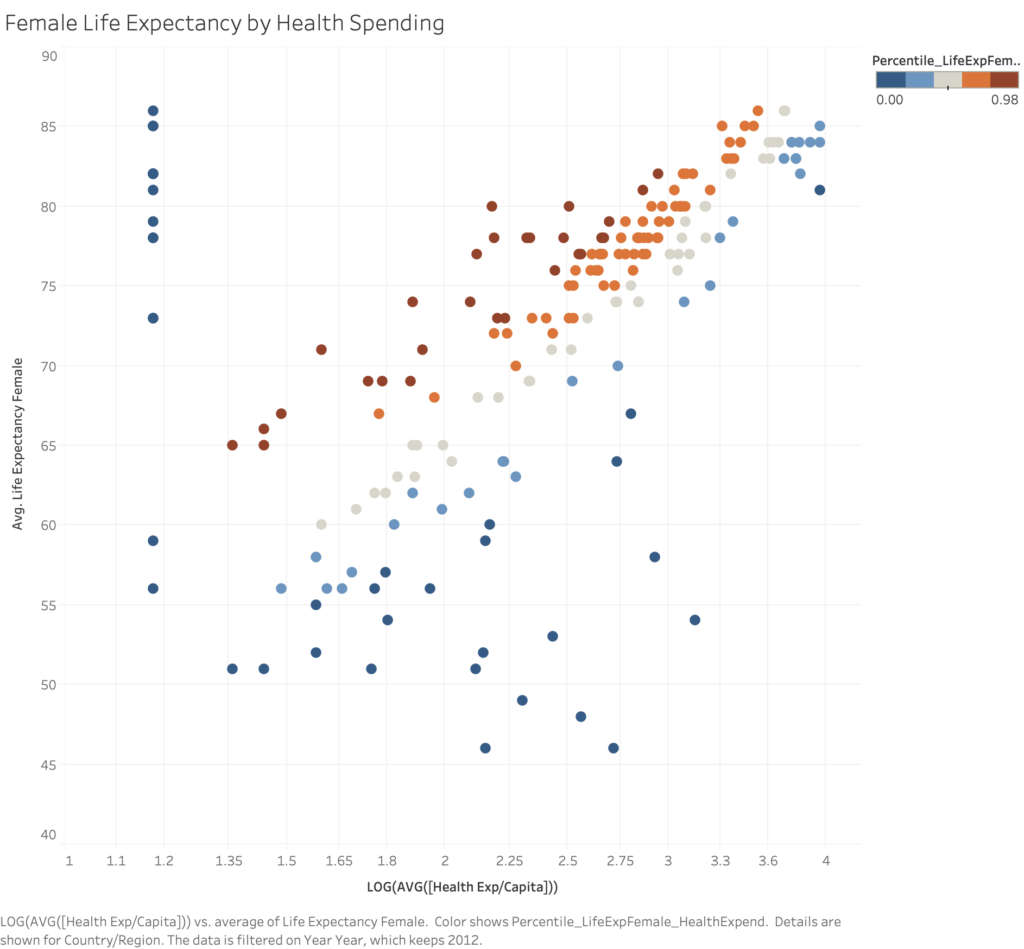
MODEL_PERCENTILE
Con la nuova Table Calculation MODEL_PERCENTILE potremo ottenere la probabilità che un valore non osservato possa essere minore o uguale a un dato osservato, definito dal target expression, basandosi su un altro dato che svolge il ruolo di predittore. Questa funzione, per coloro che hanno competenze statistiche o che comunque fossero interessati, coincide con la funzione per la distribuzione predittiva a posteriori conosciuta anche come Cumulative Density Function (CDF) e potrà assumere un valore tra 0 e 1.
La sintassi di questa funzione è:
MODEL_PERCENTILE (target_expression, predictor_expression)
che applicata al nostro esempio sarà
MODEL_PERCENTILE(AVG([Life Expectancy Female]), LOG(MEDIAN([Health Exp/Capita])))
- target_expression: corrisponde alla misura che il modello deve stimare;
- predictor_expression: il secondo (o aggiuntivi) argomenti sono i predittori (valori dunque strettamente legati con la misura che si sta stimando) e definiscono il modello; in questo caso è possibile utilizzare, Misure o Dimensioni o entrambi.
How to use and interpret MODEL_PERCENTILE
The main reason you can use this new function in Tableau is to highlight possible correlations and relationships within your dataset. The closer the resulting value is to 0.5, the closer it will be to the median of the interval and to the modeled values; where the value is close to 0 or 1, the observed case will be at the limit of what the model set assumes, given the selected predictors.
MODEL_QUANTILE
The MODEL_QUANTILE function returns the target value at a given percentile, based on other predictive criteria (Posterior Predictive Quantile). The result obtained will be a value with a probability range defined by the target_expression and the predictors; it is essentially the inverse of MODEL_PERCENTILE.
The syntax of this Table Calculation is:
MODEL_QUANTILE (percentile, target_expression, predictor_expression)
whose
- percentile: this value must be a decimal number between 0 and 1 and specifies the percentile to be used for estimation (e.g. 0.5 equals the median of the reference value);
- target_expression: corresponds to the measure that the model should estimate;
- predictor_expression: the third argument corresponds to the predictor value that we want to consider in the model (remembering that as with the MODEL PERCENTILE, even here the arguments can be more than one according to our analysis).
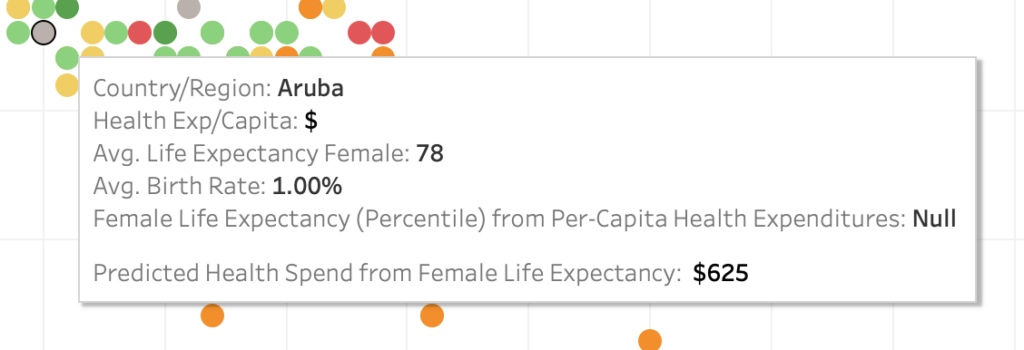
How to use and interpret MODEL_QUANTILE
The main application of this new function is to generate numerical predictions, given the predictors and target percentile specified. MODEL_QUANTILE can estimate any missing values but also make projections for future dates, or even hypothesize different scenarios where existing relationships in the dataset are redefined. Finally, an equally important application, when it comes to making estimates and assumptions, will be to calculate confidence intervals to quantify the level of uncertainty of the same predictions.
Now that you’ve discovered the new features for creating forecasting models in Tableau, there’s no excuse not to use it! Download your trial version now here. Keep following us on our blog and on our social channels LinkedIn and Facebook.