Tableau dashboard extensions are web applications that enable two-way communication and are enabled in all types of scenarios, making every single detail customizable.
They take the form of .trex files, which hold information such as name and location.
AppsforTableau, division of Infotopics (Gold Partner Tableau) and Visualitics partner for the Italian market, offers a series of interesting extensions:
SuperTables
Tables are widely used in Tableau Dashboards. They are typically used to create context boxes, analyze a simple hierarchy or add other details to visualizations. Tableau tables offer great general functionality, but when it comes to grouping or filtering, for example, the functions available are limited.
With the “SuperTables” extension you can offer your dashboard users the power of interactive and dynamic tables, allowing users to decide how to organize or analyze data in a flexible grid.
The “Show me More” extension is key when you need to incorporate visualization types not included in Tableau’s default “Show me” set.
Would you like to incorporate an interactive Sankey chart to visualize flows? Do you urgently need a flexible radar chart in your HR dashboards? With the extension “Show me more” you can display a dynamic network chart in the Tableau dashboard to illustrate the structure of your department.
The “PictureThis” extension offers urls, images, background shapes and allows you to create dynamic image tables, which can be used as filters in your dashboard.
Thanks to this extension, the images used in the dashboard can be taken from specific data sets and processed automatically to obtain an attractive and above all responsive result, suitable for any type of device. The images will act as a filter for other worksheets included in the dashboard itself.
The power of Tableau’s data analysis and all the metadata used in the visualizations is well known to Tableau users. But what lies behind the dashboards themselves? Thanks to DashboardGuide, there are no more secrets!
The DashboardGuide extension for Tableau helps you save time, improve the quality of presentations, provide background information, purpose or even KPI definitions for your dashboard. You can explain people how and why you developed your dashboard and how you did it to improve the user experience.
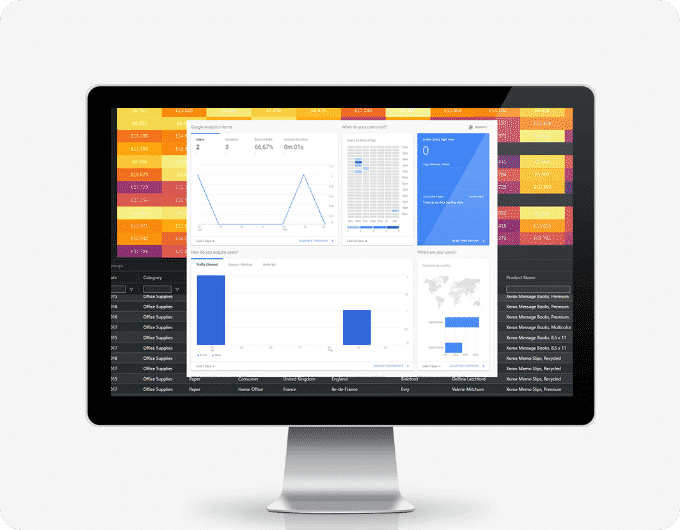
If you want to know how to make the most of your dashboards by gaining insight into how users interact with the views, Dashboard Usage is the perfect extension. By analyzing the data collected, you can turn your dashboards into valuable and strategic sources of information for future decisions.
“Dashboard Usage” is based on Google Analytics, the most reliable and comprehensive tool for monitoring all traffic and content viewed, clicked and searched by users.
The greatest customer satisfaction is achieved when you offer attractive, high-performance dashboards. That’s why the free “Performance Insight” extension for Tableau helps all creators and developers get information and feedback on performance optimizations for their dashboards.