


Creating a timeline on Tableau can be a great way to visualize a trend in a given period of time. In this case we will create a timeline showing sales per region over a period of time from the Sample superstore data source. Let us then see how to build step-by-step a calendar on Tableau.
Step 1. Create the timeline
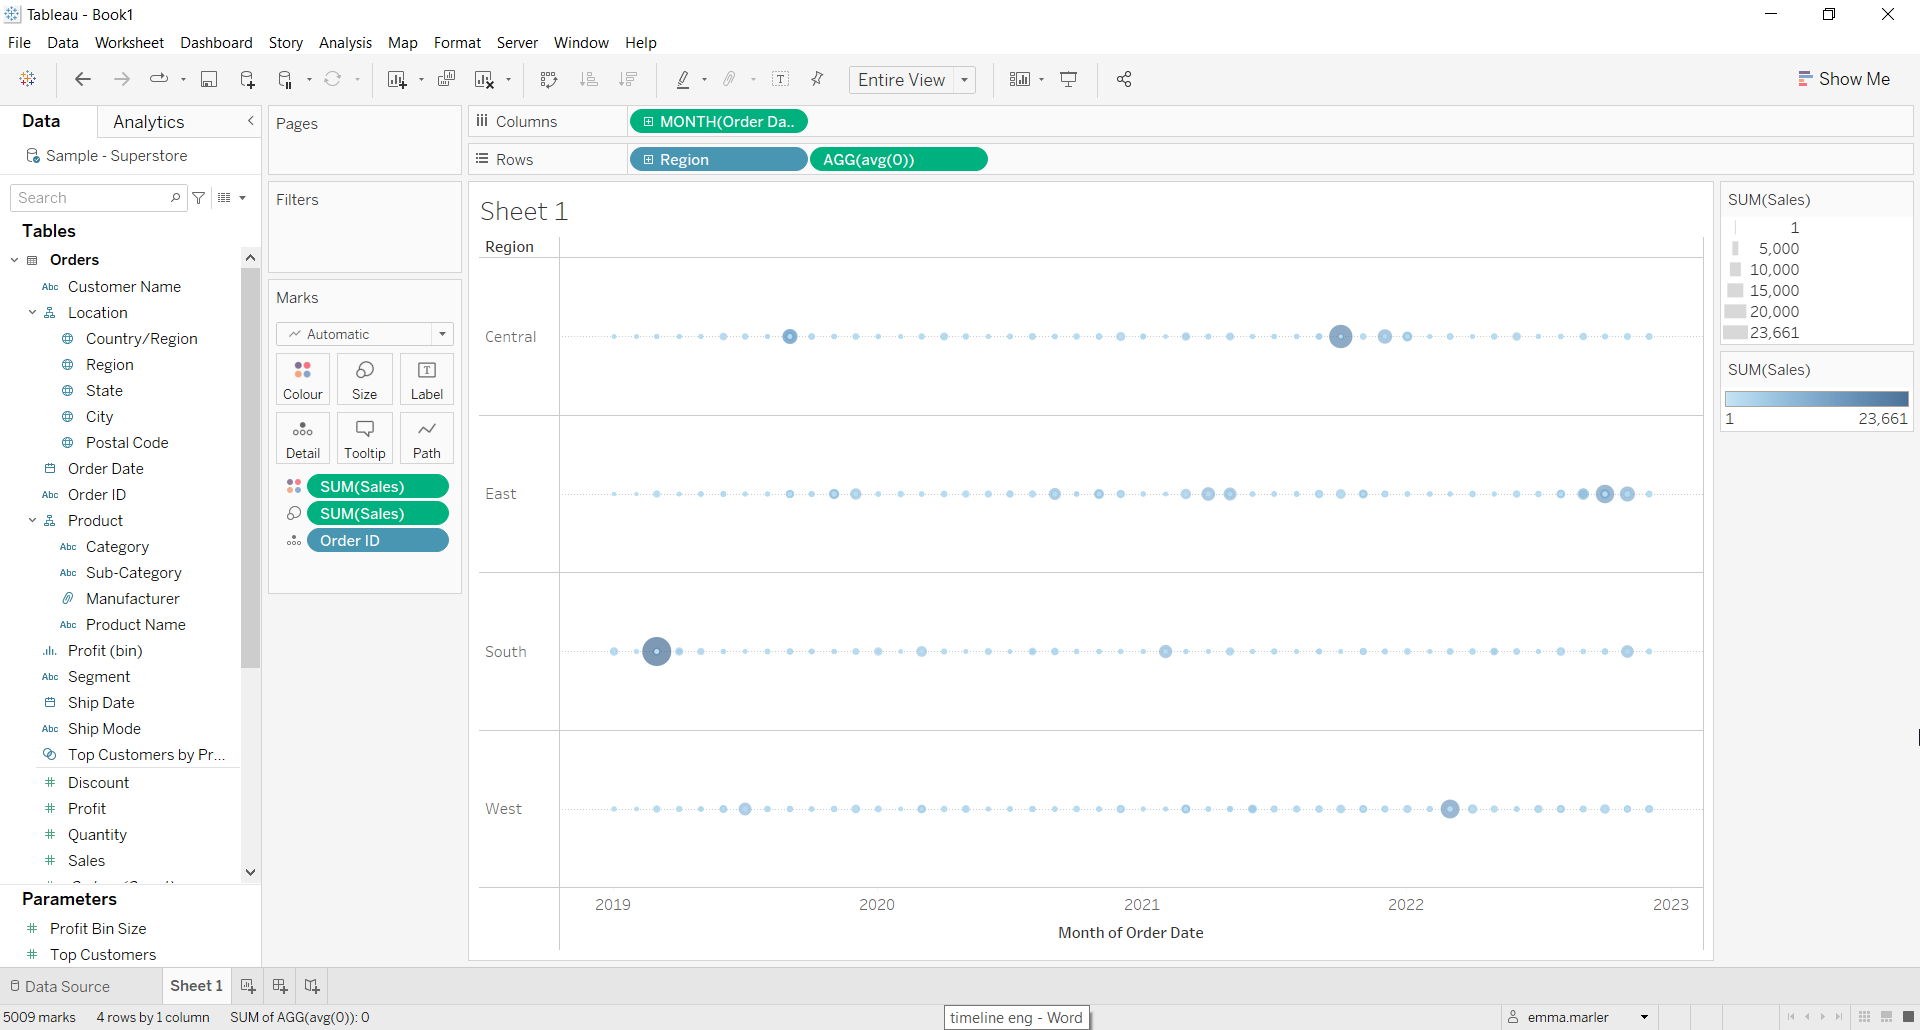
- Connect to the data source Sample Superstore.
- Drag Region on Rows.
- Double click on Rows and type avg(0).
- Drag Order date on Columns. Right click on it and select Month May 2015.
- Drag Order ID on Detail in the Marks card.
- Drag Sales on Size in the Marks card. Adjust the size to make it bigger.
- Drag Sales on Color in the Marks card.
- Click on the y-axis and select Show header. Done!
Don’t wait! Contact us to learn more and continue to follow upcoming news on our website and LinkedIn channel.