


The Best Chess Openings
According to the Top 10 Streaming Programs compiled by Nielsen, it won the title of most watched video-on-demand program, with a total of 1.9 million total minutes of viewing.Set in the 1960s, “The Queen’s Gambit” tells the story of Beth Harmon, a wunderkind vying to become the world’s first chess master.
The series has also produced incredible results on the market: sales of books and chess sets, as well as views of videos on Youtube showing the games of the most famous chess players to fans, have increased dramatically to touch 87% more than in previous months.
We at Visualitics were also fascinated by this phenomenon; already in the past we had reproduced the retro game Labyrinth in Tableau. Therefore, we thought to show in this article two visualizations on this theme that, despite dating back to a few years ago, have captured our attention.
The first, created by Data Literacy CEO Ben Jones in 2012, reports the most successful chess openings in history.
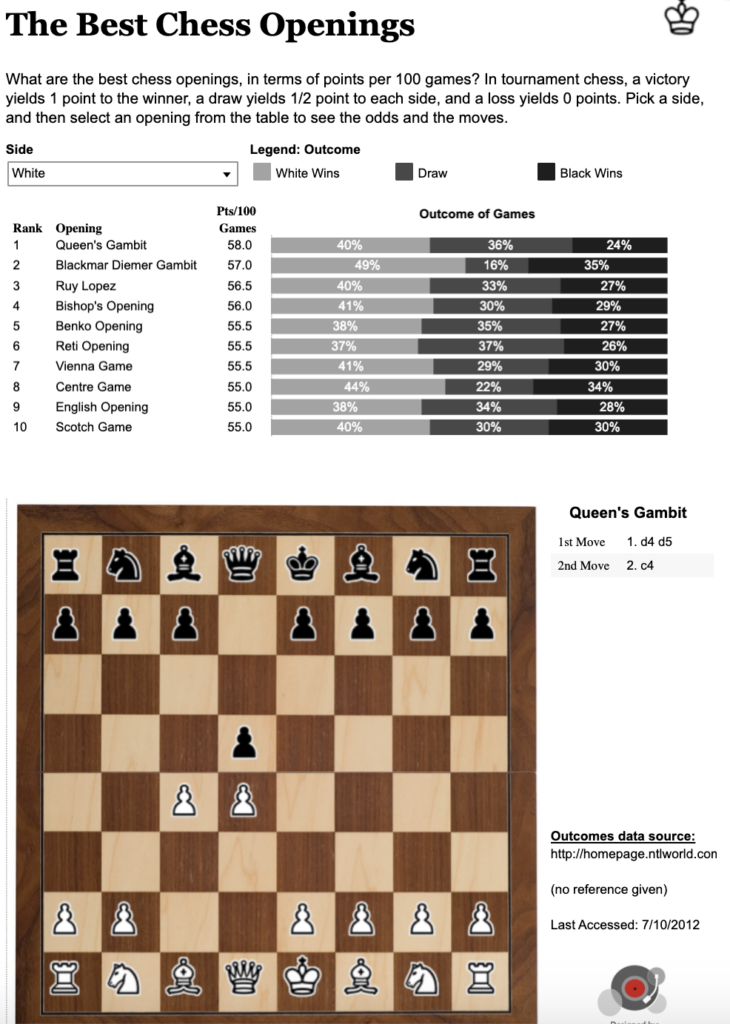
The process by which this dashboard was built, and its data source, are quite laborious; therefore, those interested in learning more can find them here.
The second one, however, refers to a 2016 work by Tamás Földi, who reproduced a real Chess Board with Tableau. You can play a game and move your pawns as if you were facing a live opponent.

To do this, the author used Tableau Server‘s JavaScript API; he explains how in this article, where you can also view the dashboard published on Tableau Public.
Would you like to see a chess-themed dashboard from us? Let us know by writing to info@visualitics.it and keep following us on our Facebook and Linkedin pages!