


How to create a bubble map in Tableau
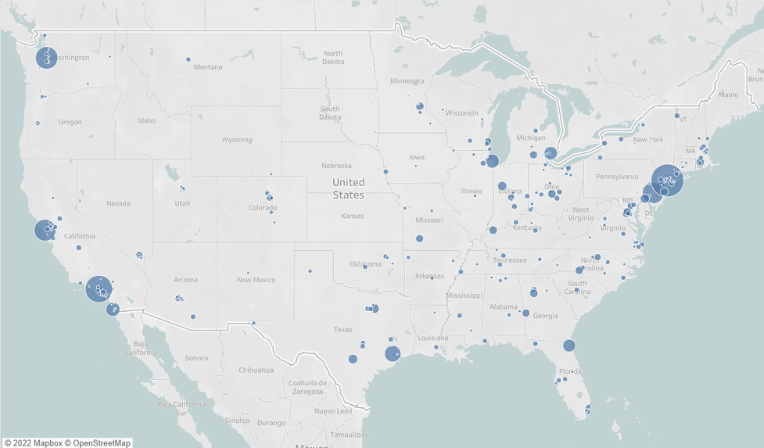
Bubble maps are an extension of dot maps. They are a great way to visualise where the highest concentration of data is located on a map. Let us then see how to build step-by-step a bubble map showing sales by city and state on the US map from the Sample Superstore data. Step 1. Create […]