


How to create a stream graph in Tableau
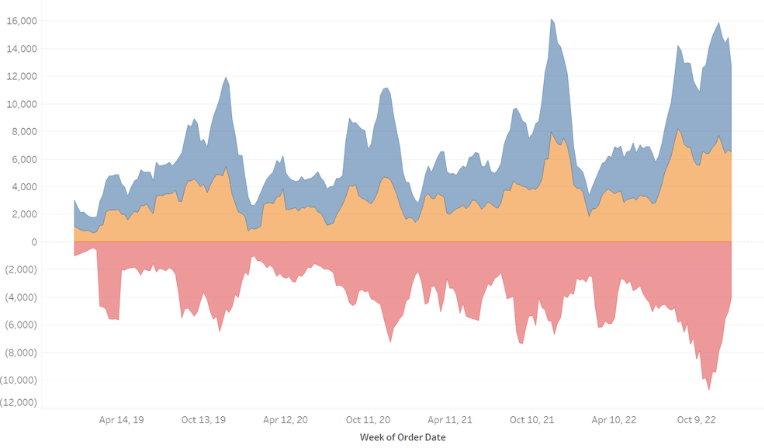
Stream graphs are often used to show changes of different categories over time. The height of each individual stream shape shows how the value of that stream has changed over time. The length of the stream shape shows its duration. Let us then see how to build step-by-step a stream graph on Tableau. Step 1. […]