


How to create a panel line chart in Tableau
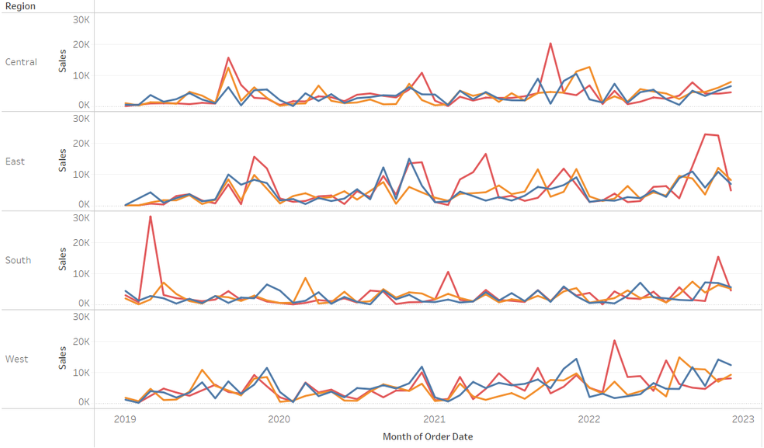
A panel chart is a perfect way to understand data that has several variables to be visualised by making individual smaller charts one next to the other, making them easy to compare. You can make panel charts with lines, bars, areas, etc. Let us then see how to build step-by-step a panel line chart on […]