


How to create a Candlestick chart on Tableau
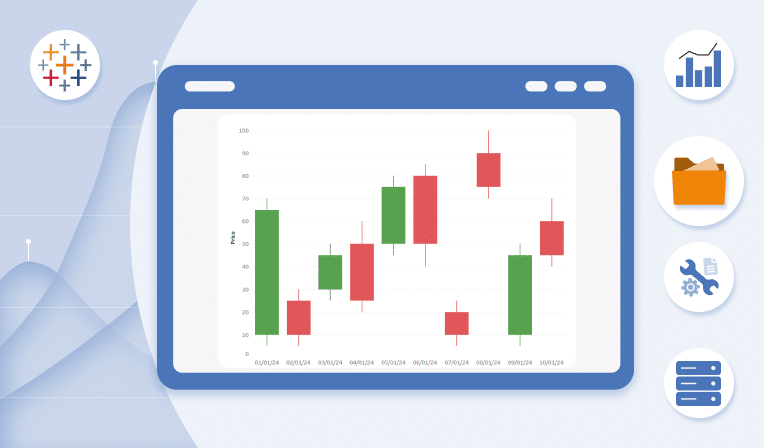
In this article, we will illustrate how to construct a Candlestick chart using Tableau, starting from downloading the data to the creation of specific calculated fields to display price movements, volatility, and trends. We will highlight the importance of this chart in technical analysis, emphasizing how its understanding can significantly improve trading strategies, providing investors […]
How to create a Progress Bar Chart in Tableau
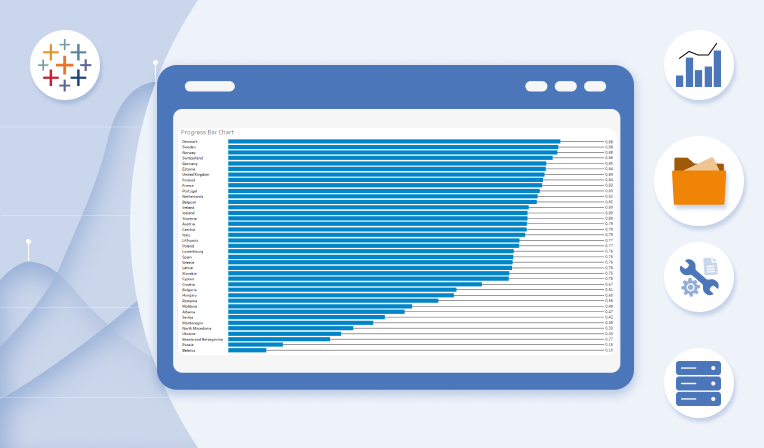
In this article, we will explore the Progress Bar Chart in Tableau, a powerful visualization that allows for the representation of progress towards a specific goal. You will discover how to construct a bar chart that represents an indicator from 0 to 1, how to compare a value with the maximum in the dataset, and […]