


How to create a rounded bar chart in Tableau
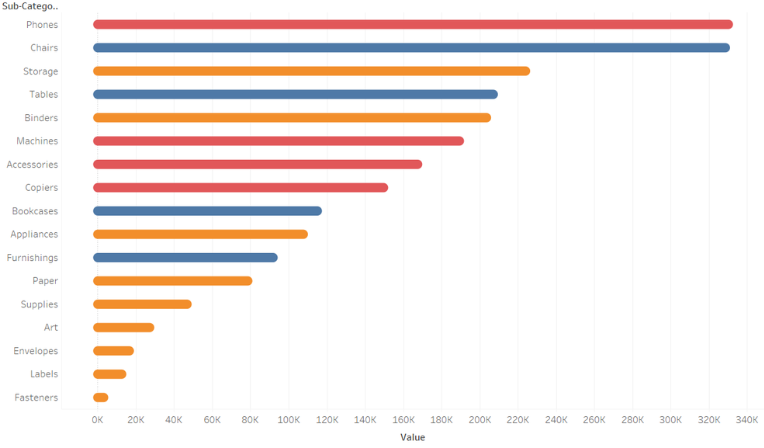
A bar chart is perfect for visualizing your data according to different categories or subgroups. To construct a bar graph, one variable must be quantitative and the other qualitative. Let us then see how to build step-by-step rounded bar graph on Tableau. Our goal is to create a graph showing sales for each category and […]