


How to create a waterfall chart in Tableau
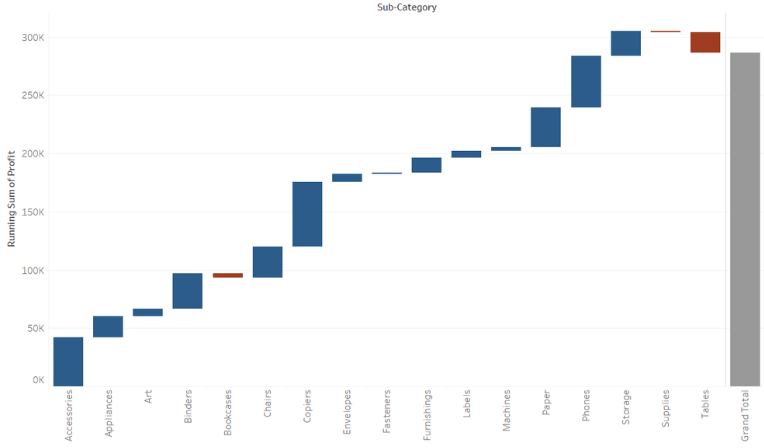
A waterfall chart can be used to show either sequential or categorical data. It uses a series of bars that show gains and losses by displaying a running total as values are added or subtracted. Let us then see how to build step-by-step a waterfall chart on Tableau. Our goal is to create a graph […]