Data Visualization in Children’s Books: An Educational Tool to Simplify Learning
Today, we explore how Data Viz can facilitate learning. Data visualization has transcended the boundaries of technical and professional fields, finding a prominent place in the education of young children. This article delves into why data visualization is crucial for children, its benefits for young students, and how it impacts various subjects.
An example of Data Visualization in children's education
By transforming complex data into engaging visualizations such as charts, diagrams, and infographics, these tools not only make learning more understandable but also much more enjoyable.
Credit: www.nightingaledvs.com
Various class activities for children to understand the concept of the bar charts.
Why Use Data Visualization for Kids?
Humans tend to remember things more easily in a visual manner, and children naturally learn this way as well. They grasp concepts better when they can see and interact with them in colorful and playful formats. This approach not only simplifies complex ideas but also keeps their attention, making learning a more enjoyable experience.
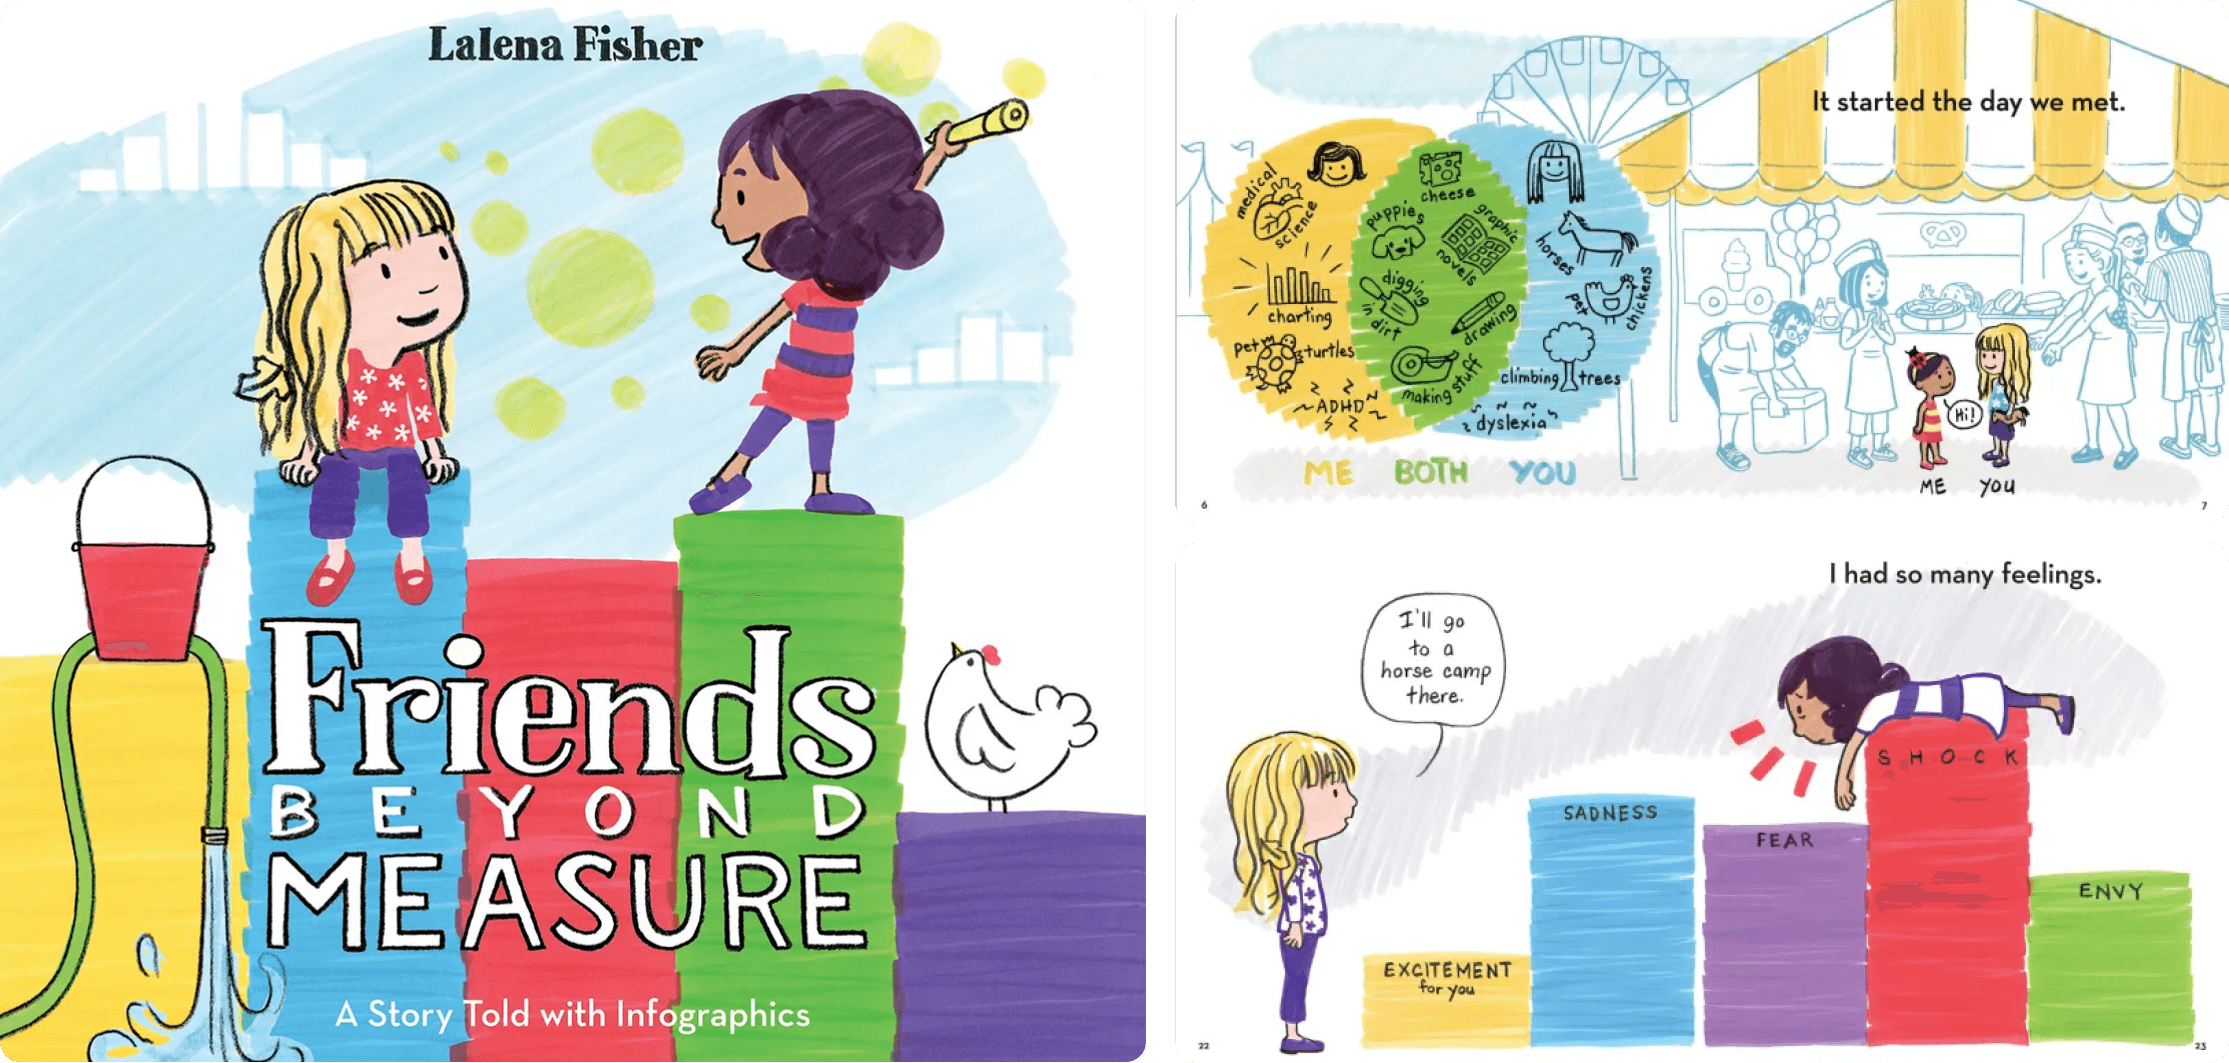
Credit: www.amazon.it
Sections from the children’s book Friends Beyond Measure by Lalena Fisher.
Benefits for Young Learners
For kids, educational content designed with bright colors and dynamic images makes the learning process appealing. Whether it’s a chart showing simple math problems or a diagram explaining the water cycle, visuals help embed these concepts more deeply and clearly in young minds.
Credit: www.pbskids.org
Introduction to bar charts with the Curious George Hat Grab Game.
Credit: www.pbskids.org
Introduction to bar charts with Peg + Cat.
Impact Across Subjects
Visuals are incredibly versatile and find their place across various subjects:
Math and Science: Visual aids like pie charts or life cycle diagrams make numbers and scientific facts easier to digest.
Reading and Social Studies: Timelines and story maps can bring historical events or stories to life, helping children understand and remember them better.
The Graph Contest by Loreen Leedy that they enter a graphing contest as they battle it out with quantity graphs, circle graphs, bar graphs and venn diagrams with a variety of objects.
Credit: www.amazon.co.uk
Data Analytics: A Children’s Book for Future Data Nerds by Jordan Washington is the perfect introduction to basic analytics and data science concepts for children.
Examples of Great Visual Learning Resources
Scholastic uses visuals effectively to help kids understand basic math and science concepts.
Miss Giraffe’s Class shines in early education by using bright, interactive visuals to teach basic math and literacy.
VizKidz introduces young kids to data through colorful, fun visualizations, making even complex information accessible and engaging.
Little Miss Data uses infographics and interactive activities to introduce children to data science, simplifying complex concepts in a playful manner.
Credit: www.sbgpublishing.com & www.vizkidz.rocks
A series of books on data Viz for kids. Delving into these stories, kids will learn how to compare data sets in a bar chart, that pie charts best illustrate parts of a whole, that correlation does not equal causation, and other valuable lessons about the fundamentals of data analytics.
Credit: www.missgiraffesclass.blogspot.com
Graphic and Data Analysis Teaching Recourses by Miss Giraffe.
Visuals in Children's Books
You’ll find that elementary schoolbooks are rich with simple graphs and cute, relatable images that help explain everything from simple addition to why the seasons change. These visuals are tailored to be just right for their age, ensuring they enhance learning without overwhelming.
Credit: www.shop.scholastic.com
Scholastic’s Educative Books for Math and Numbers & Concepts using various infographics.
The Future of Visual Learning
Looking ahead, technologies like augmentedreality could dramatically enhance how visuals are used in education, offering children immersive experiences that could transform traditional learning environments into interactive worlds.
Credit: www.slj.com & www.florence-consulting.it
Conclusions
Data visualization is a powerful tool to help young students understand complex information. By transforming abstract data into tangible and relatable visuals, it not only makes education more effective but also ensures a fun experience for children. These visual tools are continuously evolving, suggesting even more exciting ways to learn.
Explore our articles on Data Visualization
Curious about Data Viz? Explore the World through data.