A Radar Chart, also known as a Spider Chart or Web Chart, is a graphical representation of multivariate data in a star-shaped format. This type of chart is commonly used to display the performance or characteristics of an item in relation to various categories or variables. The categories are arranged radially around a central point and are connected by lines, forming a web-like structure.
In this brief article, we will explore what it is, how it can be used to analyze and effectively communicate information, and most importantly, we will learn how to create a Radar Chart in Tableau.
What is a Radar Chart?
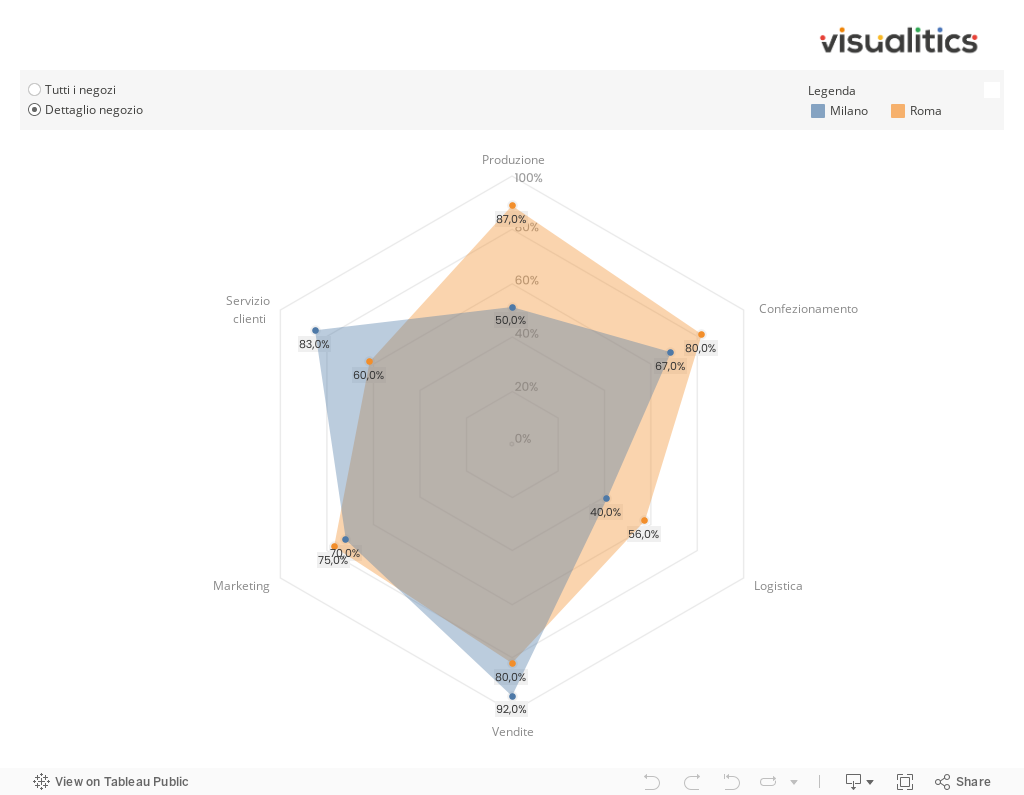
As mentioned above, a radar chart is used to visualize the performance of an element in relation to various characteristics. For example, let’s assume we want to assess the health of a company in each sector. This allows us to understand which sectors need more attention and which are already functioning well. The radar chart is perfect for achieving this goal!
In fact, we can see the performance of each sector (measured using a normalized indicator from 0 to 100) for an individual store or for the entire company, by aggregating the values with an average.
Radar Chart in Tableau
Now that we understand the potential of this data visualization tool, let’s see how to create it in Tableau. Let’s start by saying that the radar chart is not among the simplest graphs to make; but don’t worry: in this guide, we will walk through all the steps to achieve the desired result.
We also need to make another useful clarification: the process of creating a radar chart varies depending on the data structure. Let’s look at the two possible scenarios, starting from the example seen above.
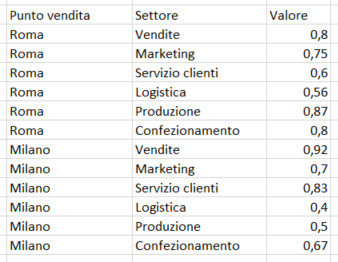
The data can be structured in a way that all numerical values are in a single column (Value) and all categorical information in rows (Store and Sector).
Data Structure | 1
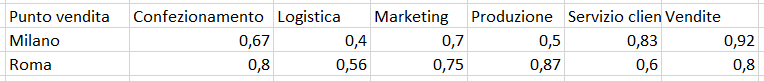
The exact same information can be structured in a table where we have one category in a row (e.g., Point of Sale) and another category in different columns (Sector).
Data Structure | 2
In the second case, the numerical values can be read both horizontally (for a single store, we see the values of each sector) and vertically (for a single sector, we see the value of each store). In the first case, however, the reading of numerical values is always vertical.
To summarize, what matters in Tableau is: are the numerical values in one column (a single field) or in multiple columns (thus, multiple fields)?
A radar chart can be created in both cases, but the processes differ.
Representing the values of a column
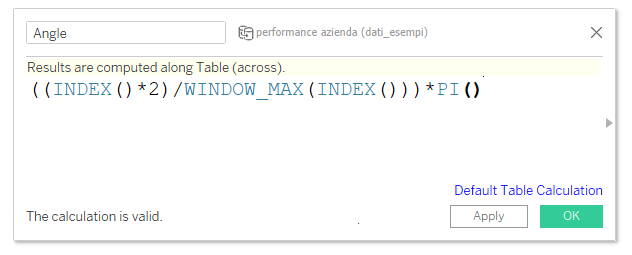
Having data structured as in case 1 is definitely simpler for creating the chart in Tableau. We start with a calculated field, necessary to calculate the degrees of each angle, which obviously depends on the number of values we need to represent. This formula works for any polygon!
In our example, there are 6 sectors, so we need to create a hexagon.
Calculated Field
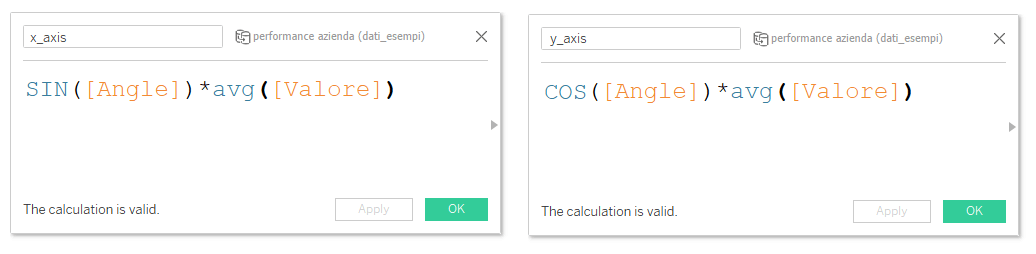
The second step is to create the coordinates for each angle. To do this, we use two calculated fields:
x_axis field, which we will place in the column (x-axis)
y_axis field, which we will place in the row (y-axis)
Calculated Field
Note: In this case, we have chosen to aggregate the value field as an average, but any type of aggregation is fine.
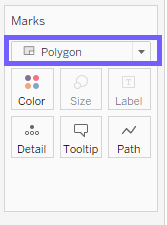
We set the chart type to polygon.
Chart Type | Polygon
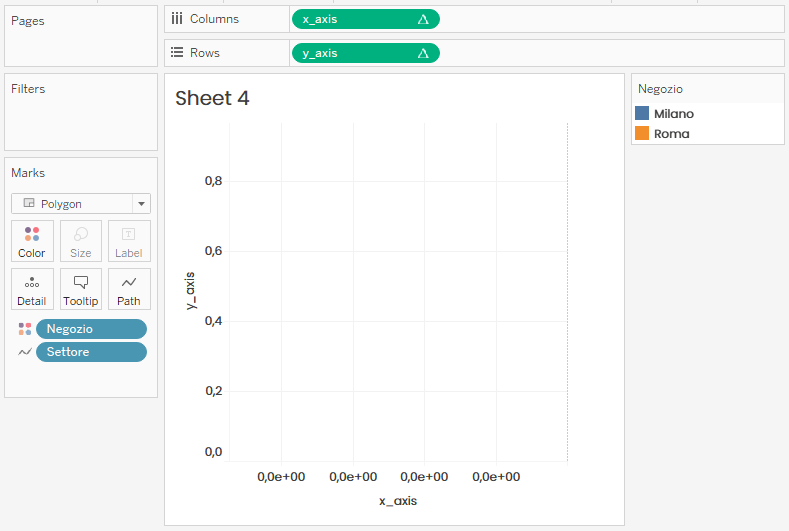
Now let’s create the chart by placing the fields in this way:
Sector in Path
x_axis in Column
y_axis in Row
Store in Color
How to place the fields
At this point, you might expect the radar chart to appear… but there’s still a crucial step missing! The x_axis and y_axis fields contain the INDEX() function, which is part of the “table calculation” functions family. Therefore, we need to right-click on each of these fields, scroll through the menu to the ‘Compute Using’ option, and select the ‘Sector’ field.
And there you have it, our radar chart is ready! All that’s left is to apply some final aesthetic touches (hide the axes, remove lines and borders, adjust the transparency in the polygons, etc.).
Conclusions
In this article, we provided a detailed overview of how to create an effective Radar Chart in Tableau, a powerful graphical representation for analyzing and comparing the performance of an element in relation to various categories or variables. We explored the process of creating a radar chart when data is organized in a single column. But what if the data is structured across multiple columns? We will soon release a new article to explain how to handle this. Stay tuned…
Read all our articles on Tableau.
Do you want to discover the latest features or delve into certain functions to become an expert?