


The sunburst chart is ideal for displaying hierarchical data. Each level of the hierarchy is represented by one ring with the innermost circle as the top of the hierarchy.
Let us then see how to build step-by-step a sunburst chart on Tableau. Our goal is to create a graph showing sales for each category, sub category and manufacturer from Sample Superstore data.
Step 1. Create the chart
- Connect to the data source Sample – Superstore.
- Create a calculated field. Let’s call it Location and type MAKEPOINT(0,0).
- Drag Location on the view.
- Drag Location in the top left corner of the view and drop it on Marks Layer as shown below. Repeat this until you have 4 Marks cards.
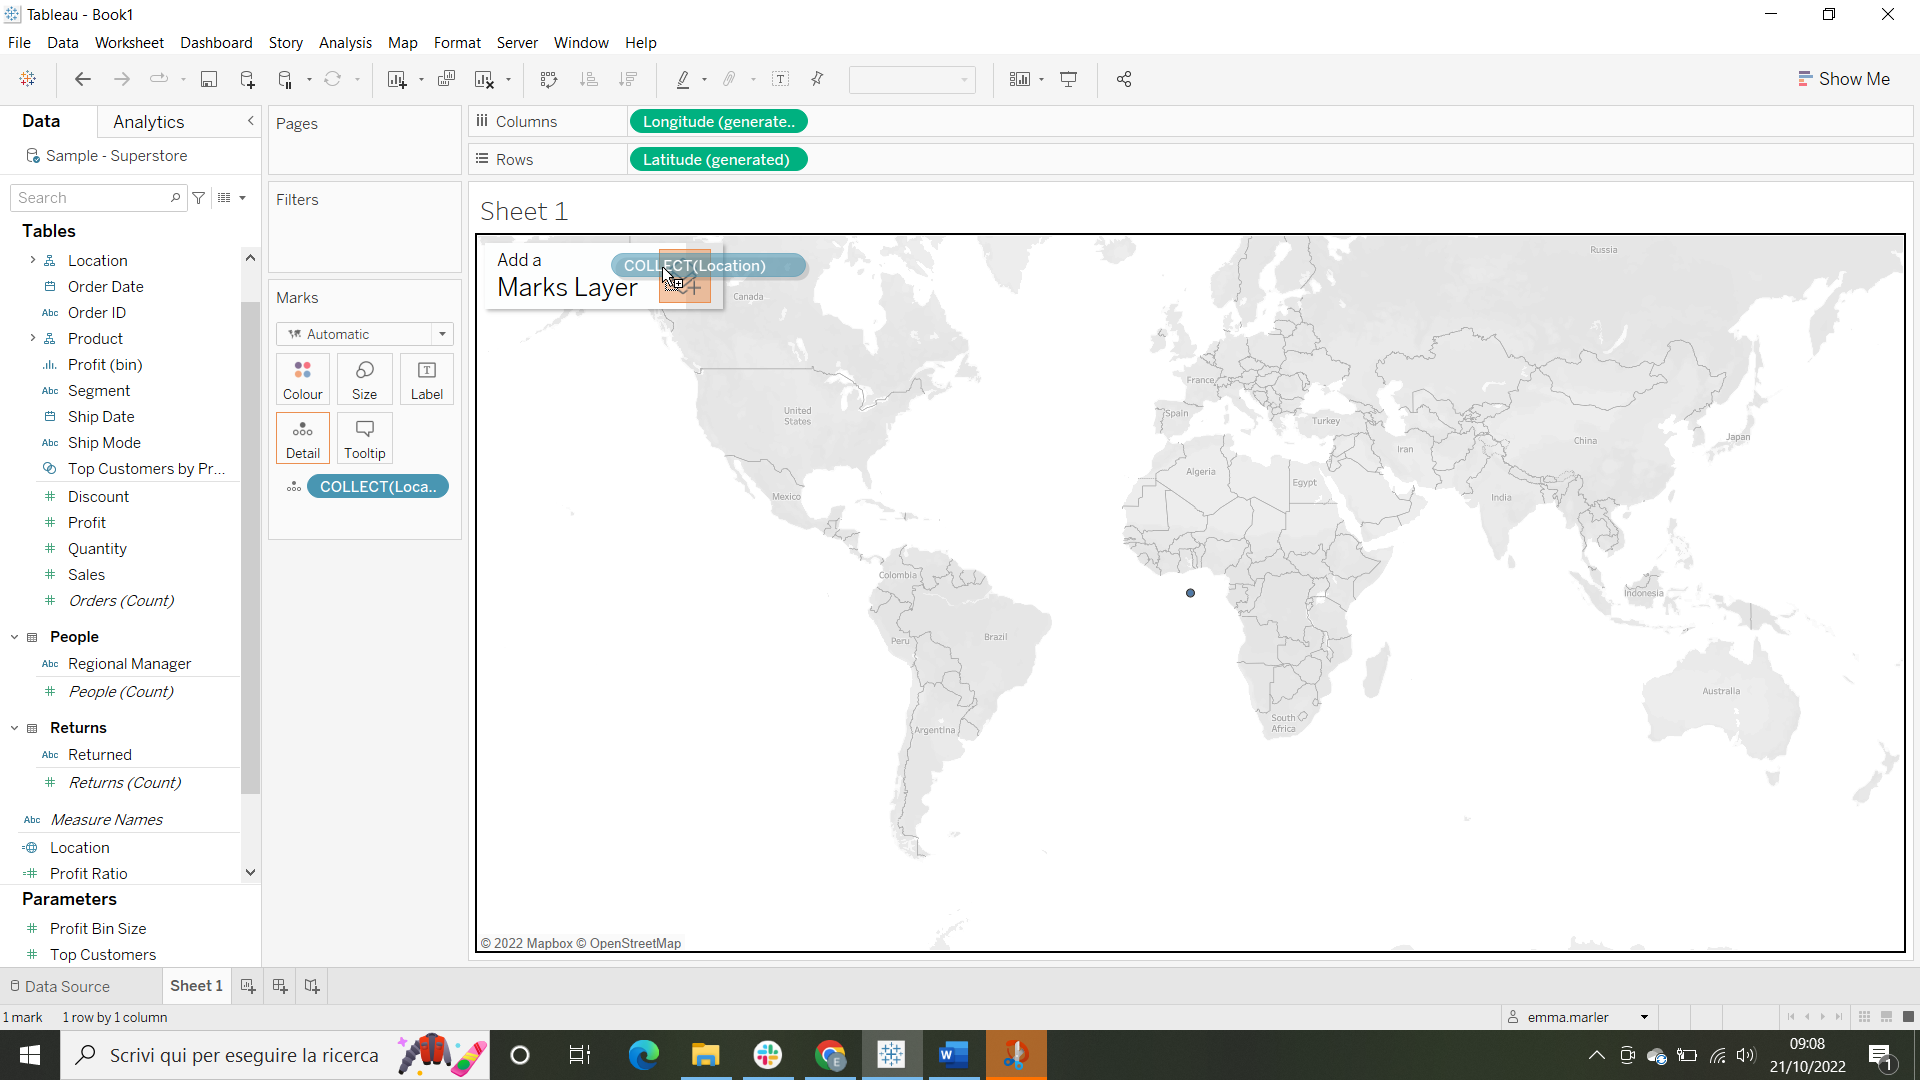
- Drag away Longitude and Latitude from Columns and Rows.
- Select the Marks card Location (4). Select Circle in the dropdown menu and choose the color White from Color. Reduce the size a little as well.
- Fit to Entire view.
- Select the Marks card Location (3). Drag Product on Color.
- Select Pie from the dropdown menu in the Marks card Location (3). Drag Sales on Angle.

- Select the Marks card Location (2). Drag Product on Color and select Pie from the dropdown menu. Drag Sales on Angle.
- On Marks card Location (2) adjust the size to make it a bit bigger.
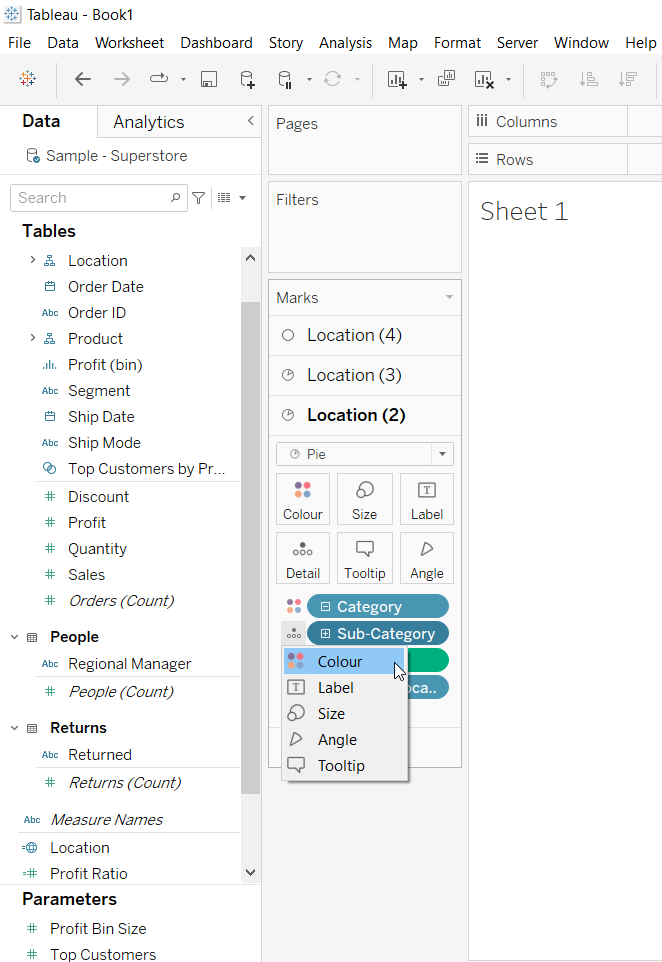
- On Marks card Location (2) click on the + sign next to Category as shown below in the black circle. A new tab Sub-category will appear.

- Now click next to Sub-category and select Color as shown below.
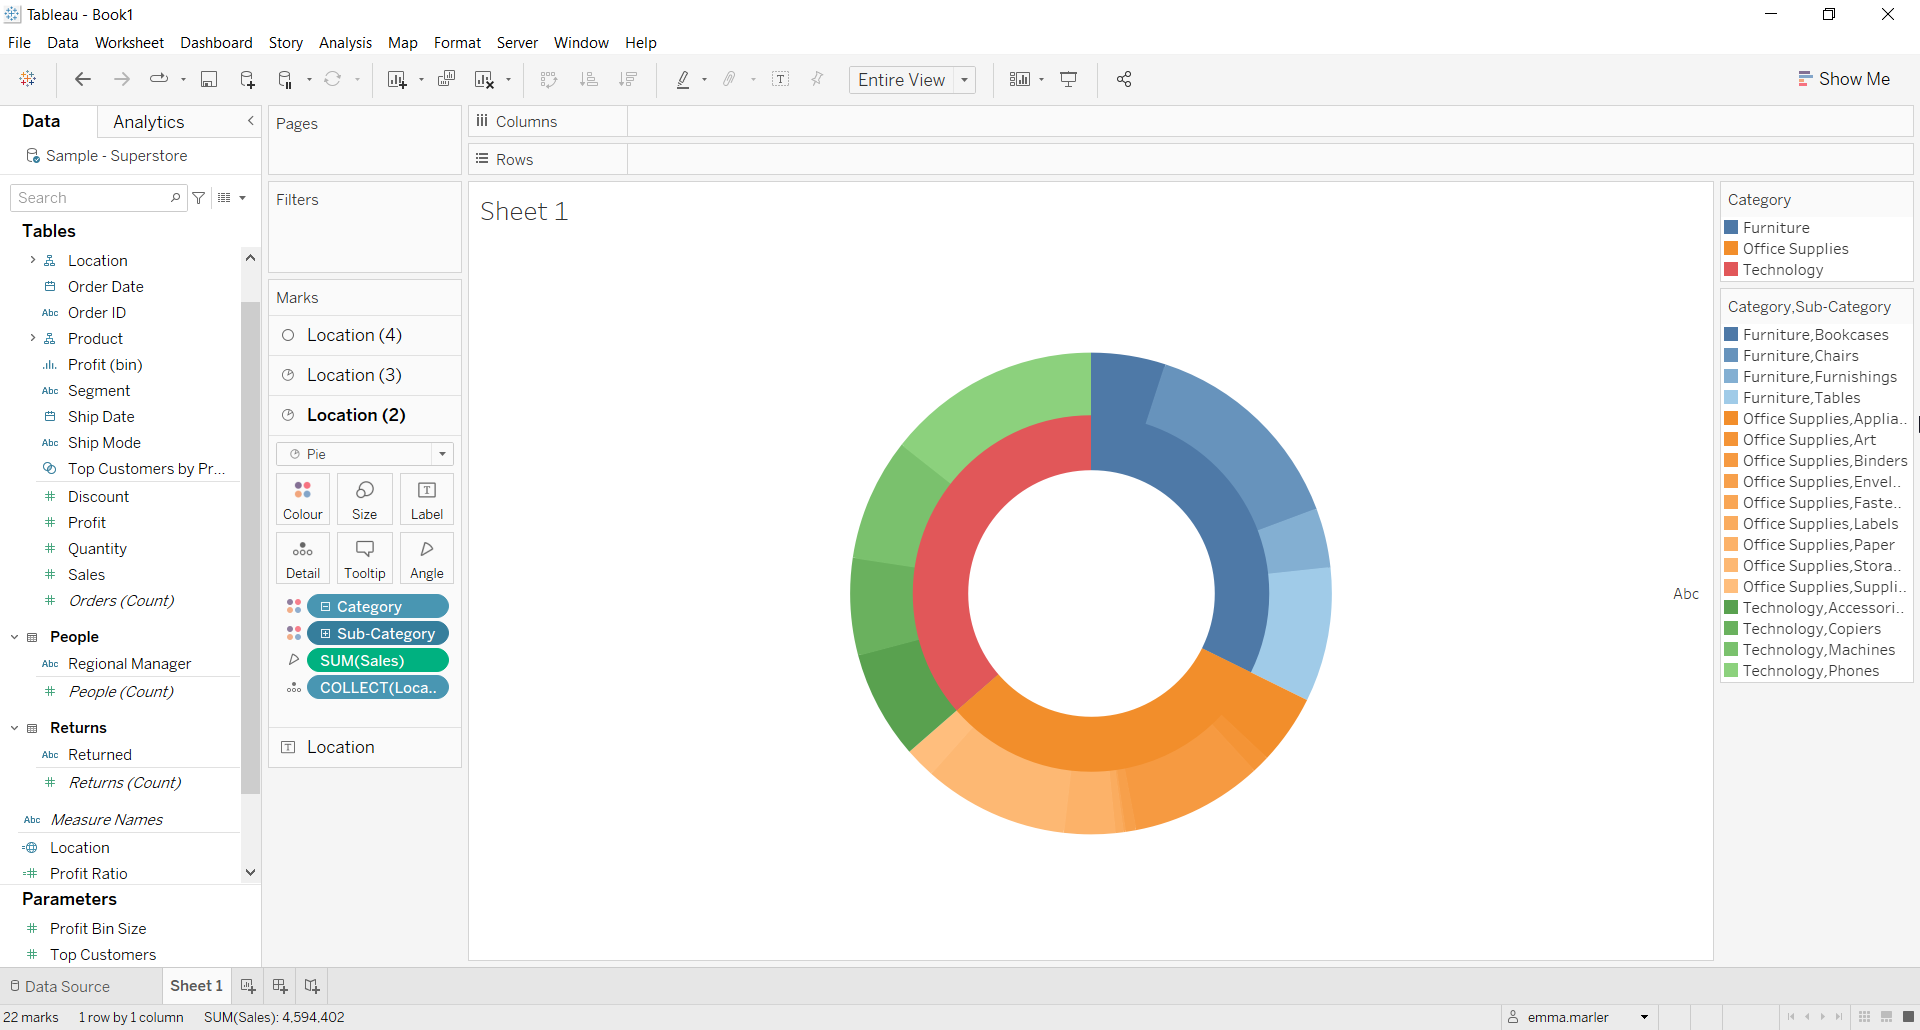
- This is what you should get!
- Select the Marks card Location. Drag Product on Color. Select Pie from the dropdown menu.
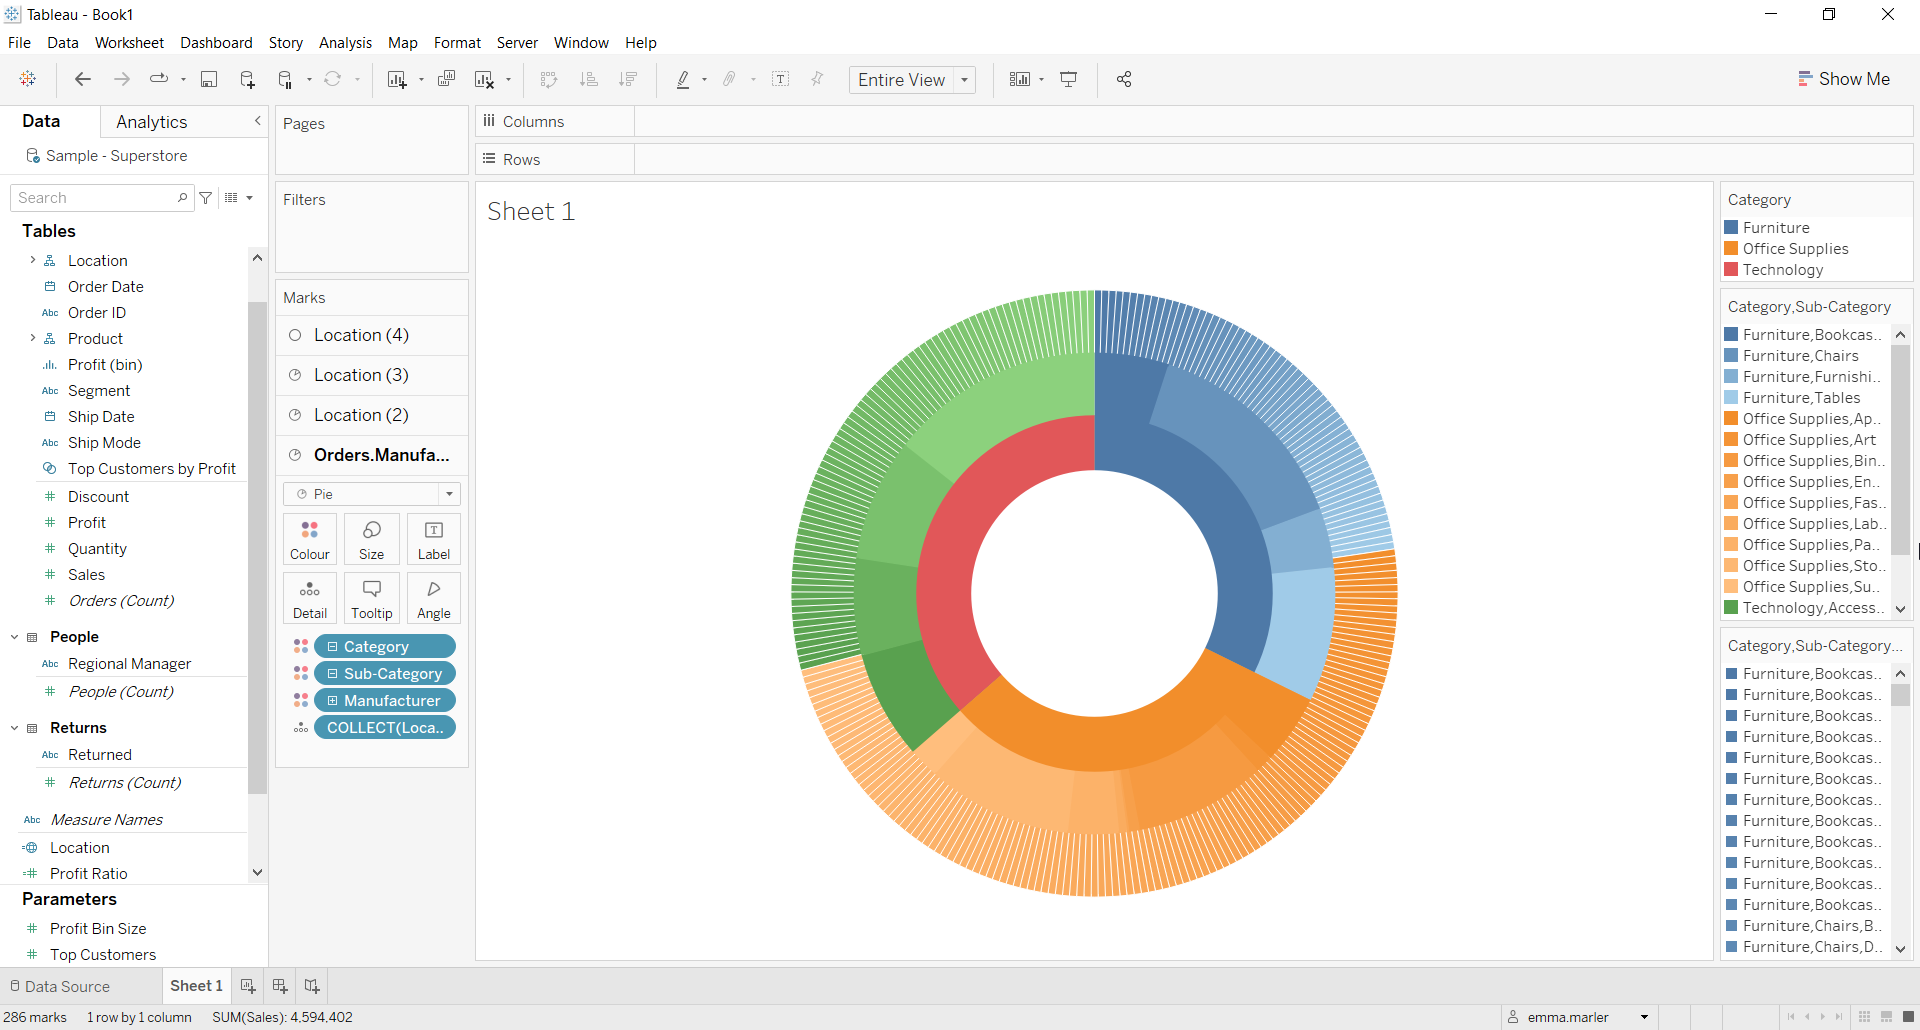
- Click the + sign next to Category so that Sub-category appears as in point 12. Click the + sign next to Sub-category so that Manufacturer appears.
- Click where the blue circles are and select Color.

- Adjust the size from Marks card Location to make it bigger.
- Click on Color in the Marks card Location and select the color white for Border.
- Drag Sales to Angle in the Marks card Location.
- Go on Marks card 2 and 3 and repeat what you did in point 19.
- Select Edit color as in the picture below and change the color of Technology to green.
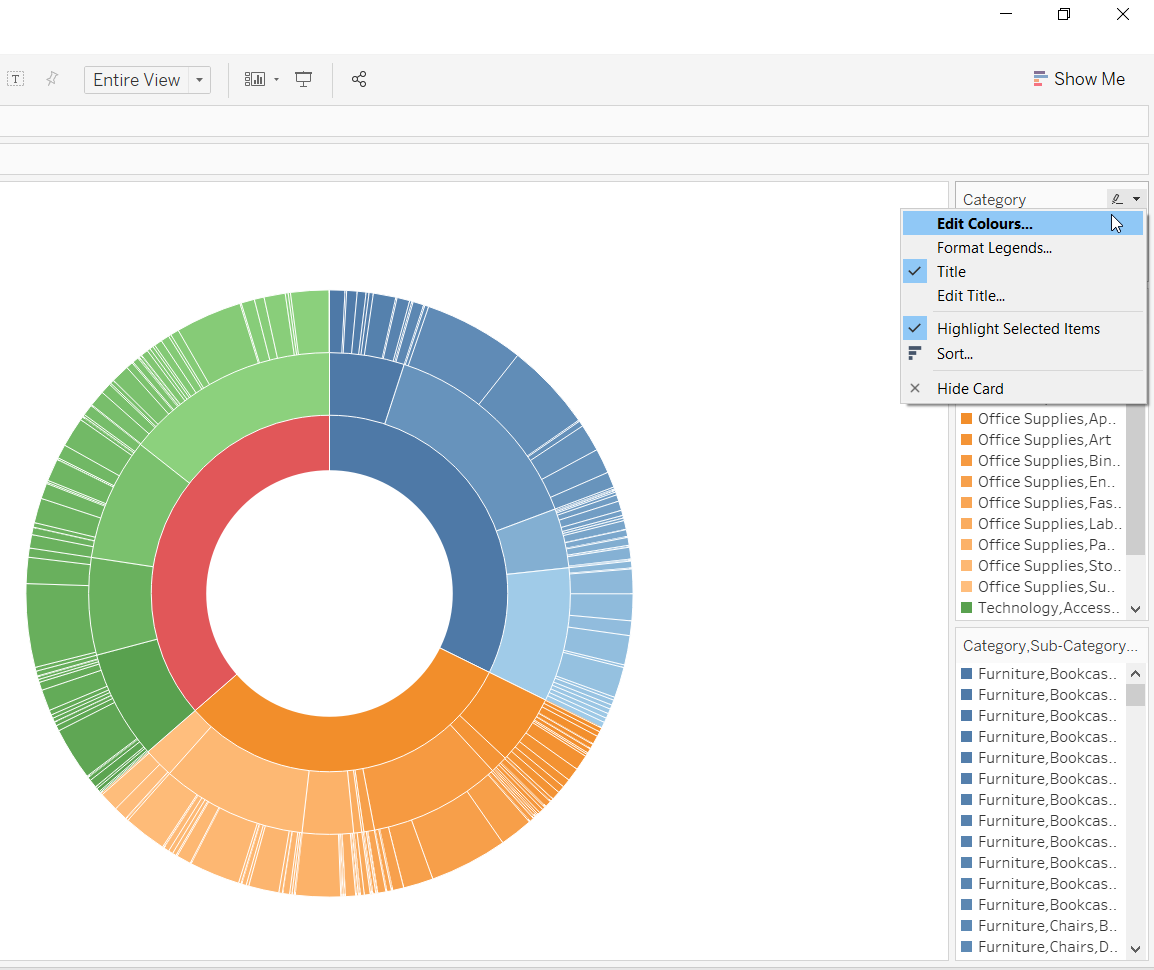
- Done!

Don’t wait! Contact us to learn more and continue to follow upcoming news on our website and LinkedIn channel.