


“Datapedia” is our monthly column where we illuminate the meanings of terms often misunderstood and confused in the world of Business Intelligence (BI) and Data Visualization.
Many concepts may seem similar, but they have distinct objectives and applications. They are often used inaccurately, leading to confusion even among industry professionals.
In this article, we will explore some groups of terms and clearly explain what they indicate and when they should be used. We will first examine the classification based on data structure, distinguishing between structured data, unstructured data, and semi-structured data. Then, we will focus on the type of data, delving into the contrast between qualitative data (nominal, ordinal, and dichotomous) and quantitative data (discrete and continuous).
Structured, Semi-Structured, and Unstructured Data
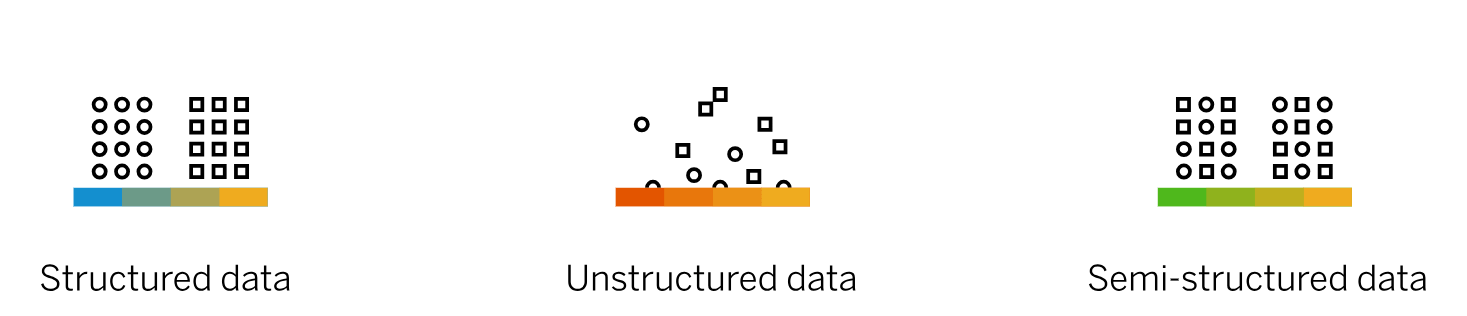
Data can be classified based on its structure into three main types: structured, semi-structured, and unstructured.
Data is structured when it adheres to a predefined data model. A classic example of structured data is tables, where each row corresponds to a record and each column is an attribute. The intersection between rows and columns identifies a cell, within which the information of interest is stored. Structured data is easy to manage and analyze.
Semi-structured data, on the other hand, does not follow a precise tabular model but still maintains a structure that facilitates analysis. Thanks to the presence of tags and other markers, hierarchies are established among fields and records. Examples of semi-structured data include XML, JSON, and HTML files, which are fundamental elements of the web.
Finally, there are unstructured data, a very broad category that includes text files, PDFs, images, emails, and more. Unstructured data is characterized by the absence of a clear organization according to a preset model; therefore, it is impossible to manage and analyze them using a traditional relational database. However, unstructured data is often accompanied by metadata, or information about the data itself: the presence of metadata (the author of a text file, the timestamp of an image, the resolution of a photo, etc.) facilitates the classification and interpretation of unstructured data.
Qualitative Data vs Quantitative Data
Qualitative data serve a descriptive function and can appear as text strings, categorical variables, but also numbers. Quantitative data, by definition, can be measured and are expressed in numerical format.

Qualitative Data: Ordinal, Nominal, and Dichotomous
Within qualitative data, we can identify three subcategories: ordinal qualitative data, nominal qualitative data, and dichotomous qualitative data.
Ordinal qualitative data express an order or hierarchy, and thus, can be easily placed on a scale. Consider a classification of the population based on body mass where individuals can be defined as very underweight, underweight, normal weight, overweight, obese, or very obese. These labels express a scale, and therefore we can associate them with a value ranging from 1 to 6. This will be convenient for subsequent analyses.
Nominal qualitative data, on the other hand, do not express an order or scale (e.g., blonde, brunette, etc.). We can certainly assign a number to each value of a nominal qualitative data (e.g., blonde = 1, brunette = 2, etc.) but any calculation based on such numbers would be meaningless.
Dichotomous qualitative data, finally, are very simple to identify: these are variables that can only take two values, such as true or false, present or absent, yes or no. Even in the case of dichotomous data, it is possible to assign a number to each value (e.g., true=1, false=0) to facilitate our analysis.
Quantitative Discrete Data and Quantitative Continuous Data
Even among quantitative data, it is necessary to make a distinction, namely between discrete quantitative data and continuous quantitative data.
Quantitative data is discrete when it can take on a finite or countable set of values. Think of a sports statistic: the points scored by a basketball player in a game. The points scored could be 10 or 28, but not 10.45 or 28.67. Therefore, the number of points scored is a discrete quantitative data.
Conversely, quantitative data is continuous when it can take on all values within a certain interval, without interruption between one value and the next. Let’s return to basketball and look at another statistic: the free-throw shooting percentage in a season. This data can take on any value between 0% and 100%; even though statistics conventionally round to the nearest decimal, in this case, we are dealing with continuous quantitative data.
Conclusions
To summarize, we have analyzed some terminological differences related to data structure. The analysis is quite straightforward in the case of structured data (e.g., tables), whereas understanding semi-structured data requires relying on their tags, labels, and other markers. Unstructured data constitutes a vast informational asset (think of text analysis), but observing them requires a greater technical effort.
We then shifted our focus to the differences between two main categories: quantitative data and qualitative data, which are rather nuanced within themselves. Indeed, quantitative data can be either discrete (e.g., points scored by a basketball player in a game) or continuous (e.g., the percentage of successful free throws). On the other hand, qualitative data can be ordinal when they can be placed on a scale (from very underweight to severely obese); we refer to qualitative nominal data when the quality described by the data cannot be categorized into a scale or hierarchy (e.g., blonde, brunette, etc.). Finally, a particular type of qualitative data is represented by dichotomous data: these can only take on two values and are primarily used to express the presence or absence of a condition.
Become an Expert in BI and Data Visualization
If you’re looking to learn the fundamentals of key BI tools or become an expert in Visual Analytics, discover our training programs.

Visualitics Team
This article was written and edited by one of our consultants.
Share now on your social channels or via email: