


How to create a Candlestick chart on Tableau
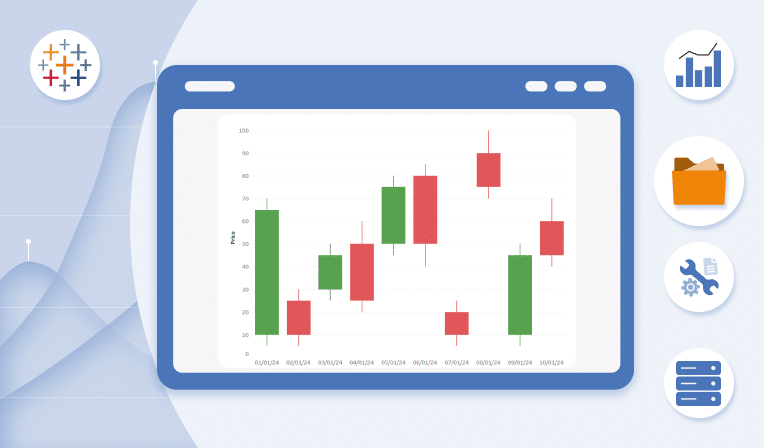
In this article, we will illustrate how to construct a Candlestick chart using Tableau, starting from downloading the data to the creation of specific calculated fields to display price movements, volatility, and trends. We will highlight the importance of this chart in technical analysis, emphasizing how its understanding can significantly improve trading strategies, providing investors […]
How to create a candlestick chart (II) in Tableau
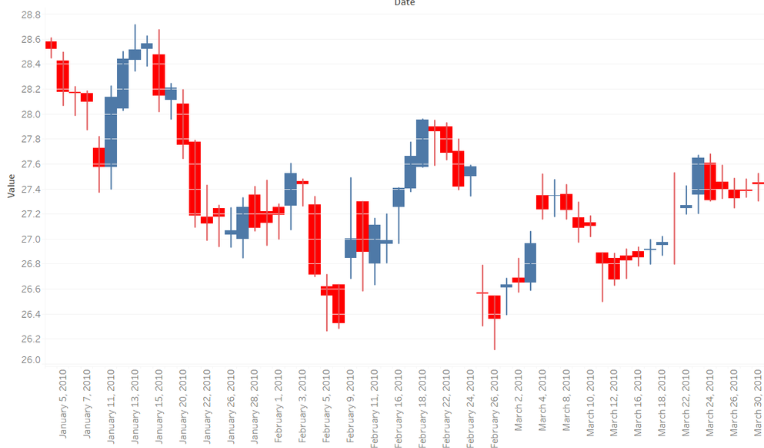
Candlestick charts are often used in finance to analyse price movements over time. Let us then see how to build step-by-step progress a candlestick chart on Tableau. Step 1. Create the candlestick chart Connect to the data source (in this case we are not using Sample Superstore). Right click on Date in the data pane. […]
How to create a candlestick chart (I) in Tableau
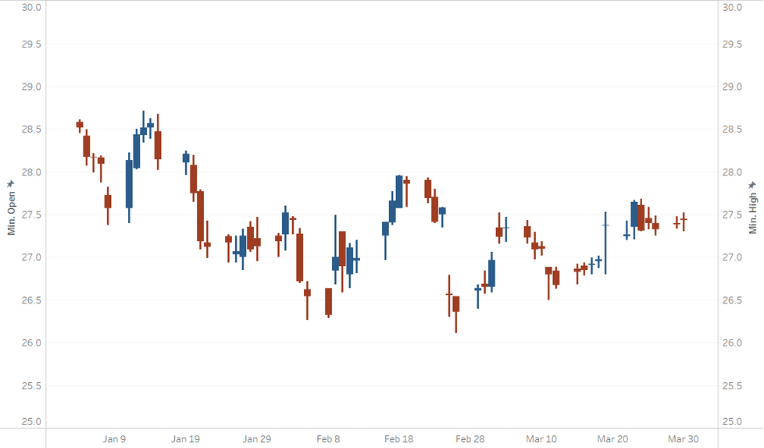
Candlestick charts are often used in finance to analyse price movements over time. Let us then see how to build step-by-step progress a candlestick chart on Tableau. Step 1. Create the candlestick chart Connect to the data source (in this case we are not using Sample Superstore). Drag Open on Rows. Right click on it […]