


How to create a Lollipop chart in Tableau
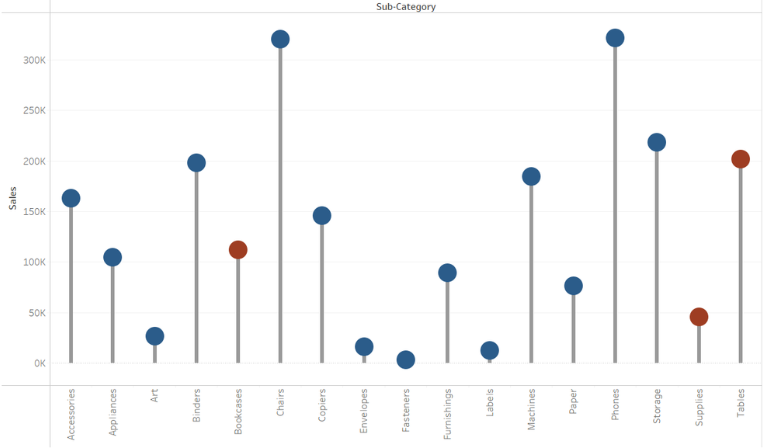
A lollipop chart is a variation of a bar chart where the bar is replaced with a line and a dot at the end. Similarly to bar graphs, lollipop charts are used to make comparisons between different categories, as well as ranking or for showing trends over time. The most common use is when the […]