


How to create a Radar Chart in Tableau (Part 1)
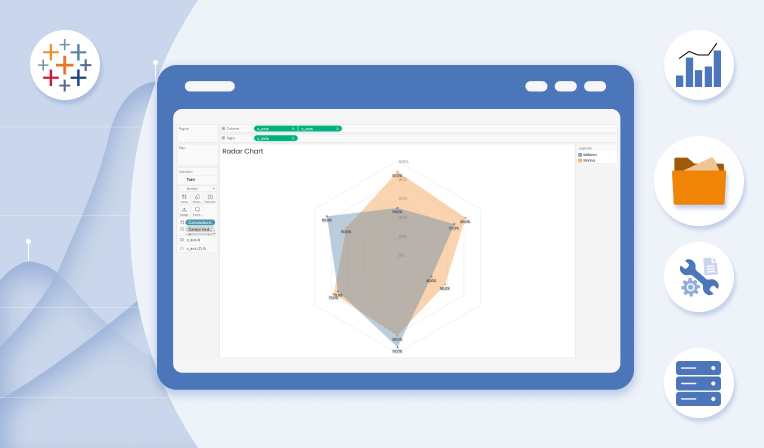
A Radar Chart, also known as a Spider Chart or Web Chart, is a graphical representation of multivariate data in a star-shaped format. This type of chart is commonly used to display the performance or characteristics of an item in relation to various categories or variables. The categories are arranged radially around a central point […]