


How to create a funnel chart in Tableau – part two
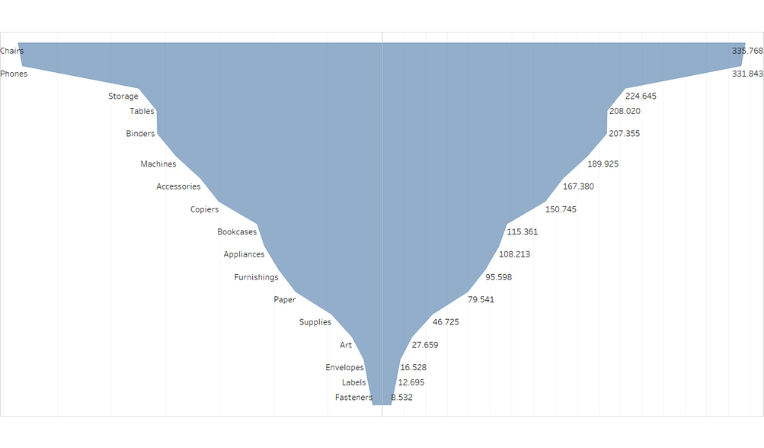
A funnel chart is generally used to visualize how data moves through a process. The chart takes its name from its shape, which starts from a broad head and ends in a narrow neck. Let us then see how to build step-by-step funnel chart on Tableau. Our goal is to create a graph showing sales […]
How to create a funnel chart in Tableau
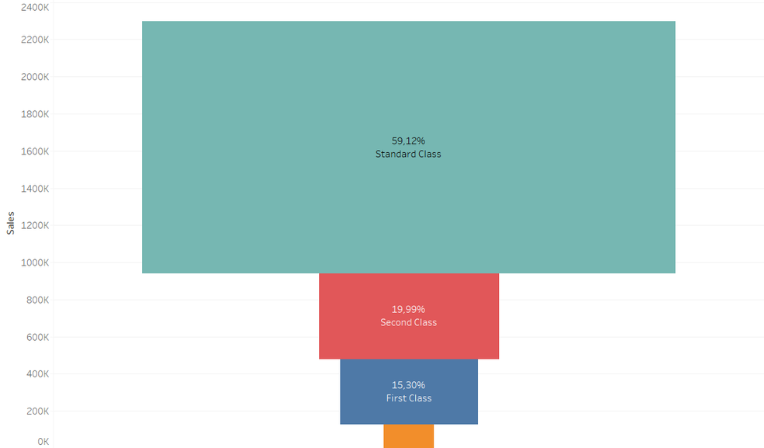
A funnel chart is generally used to visualize how data moves through a process. The chart takes its name from its shape, which starts from a broad head and ends in a narrow neck. Let us then see how to build step-by-step funnel chart on Tableau. Our goal is to create a graph showing sales […]