


How to create a slope chart with choice in Tableau
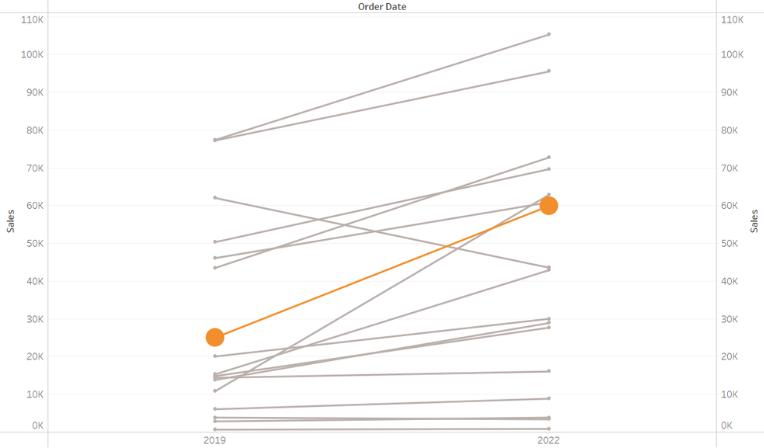
A slope chart can be used to show a ‘before and after’ story of different values, based on comparing their values at different points in time. The related values are connected by slopes. Let us then see how to build step-by-step a slope chart on Tableau. Our goal is to create a graph showing sales […]