


Often, when working with DAX, we face challenges such as creating measures that can return a Running Sum or a Moving Average. Although both concepts are not difficult to understand logically, translating them into measures is not so straightforward. To convert these concepts into DAX, we indeed need a deep understanding of basic concepts like row context, filter context, and the CALCULATE function.
In this article, we will explore what Visual Calculations in Power BI are and how they can help us, as well as the limits and advantages that this new feature can offer.
How to Add Visual Calculations to Power BI Desktop
In the February 2024 update, Microsoft enhanced Power BI Desktop with new shortcuts, making the process of creating measures (like those discussed above) smoother and more intuitive through the introduction of visual calculations.
To activate this feature in PowerBI Desktop, simply navigate to:
File –> Options and Setting –> Options –> Preview Feature –> select visual calculation in the global section and then click OK. Afterward, by clicking on a visual that supports visual calculations, the corresponding icon will be displayed on the upper navigation banner, as illustrated in the image.
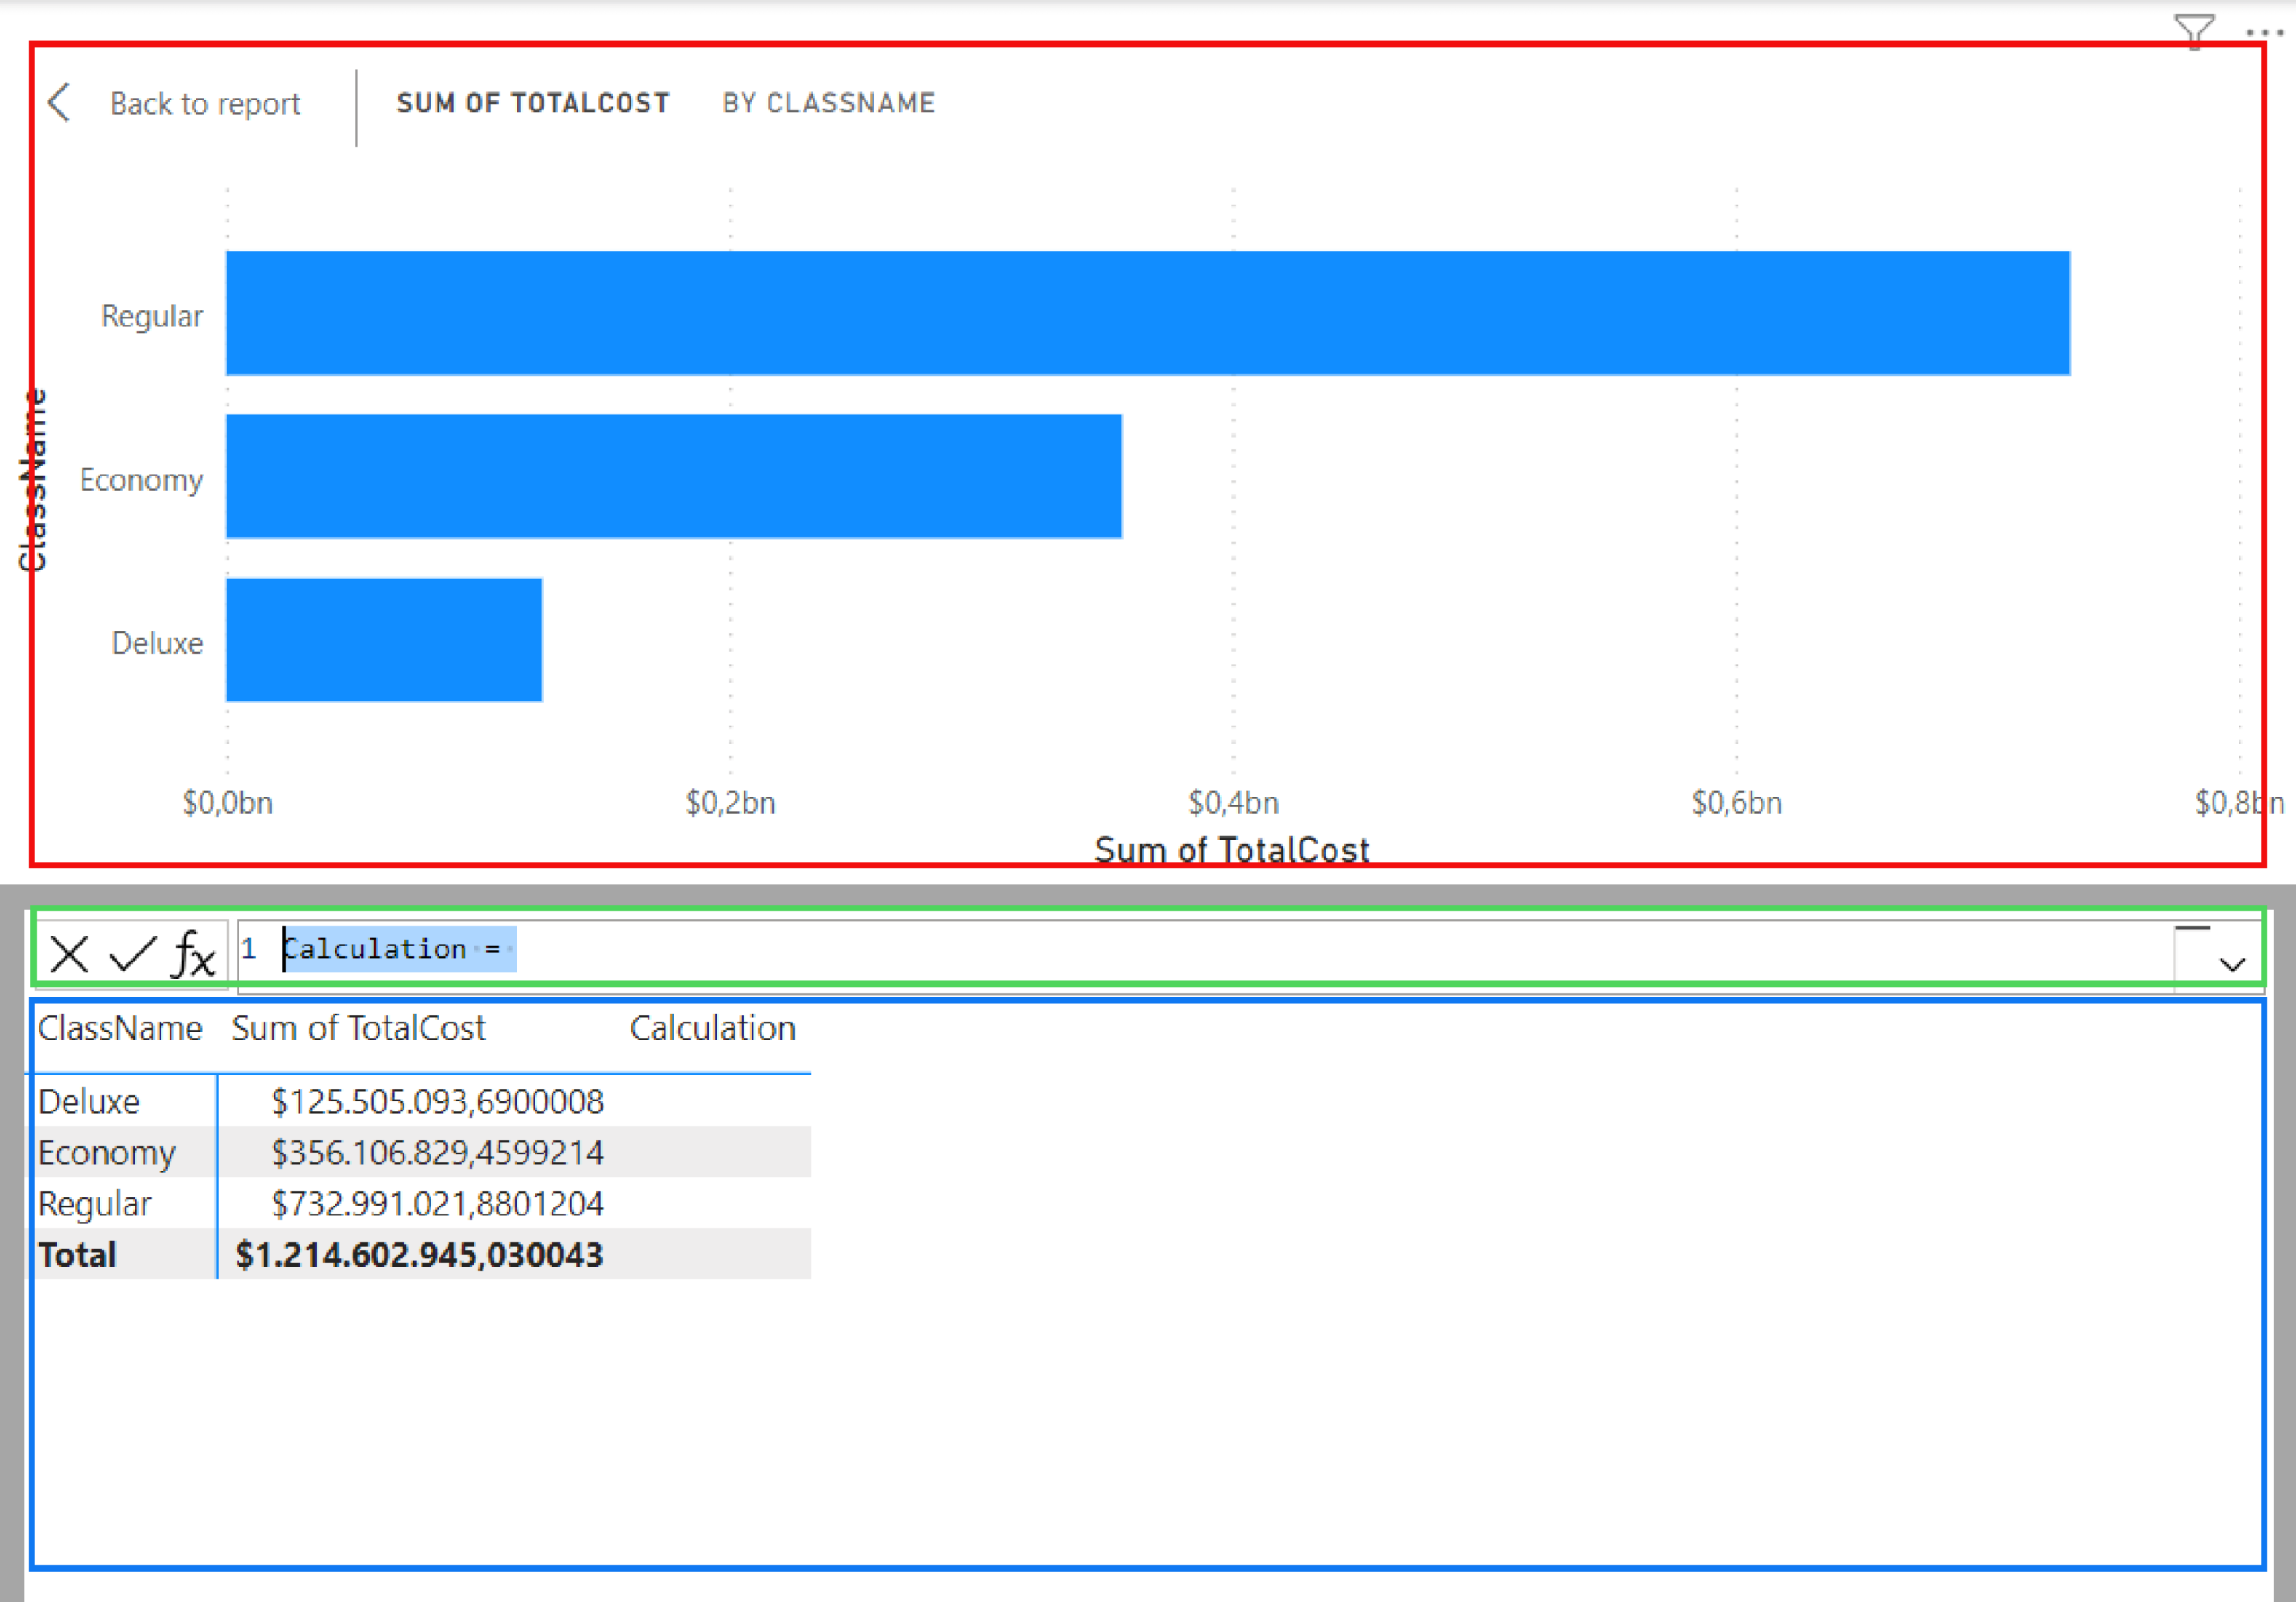
As soon as we click on “New Calculation” the canvas we are working on will be divided into three main sections:
- Visual Preview: shows only the visual on which we are using the visual calculations.
- Visual Matrix: the chart is reduced to a matrix to facilitate the calculations we are implementing.
- Formula Bar: a section where you can specify the visual calculation, with the option to choose from available templates.
Visual Calculation and Available Templates
There are several aspects that distinguish visual calculations from DAX measures. First, unlike DAX measures, visual calculations, once applied, do not become part of the data model but remain specific to each visual on which they are implemented. This means they can only reference fields or measures present in the specific visual, combining the simplicity of the row context of calculated columns with the flexibility offered by measures. Second, visual calculations operate on data already aggregated by DAX measures, resulting in a performance advantage since their computation does not significantly burden computational resources. It’s important to note that some functions available in visual calculations are not currently usable in creating standard DAX formulas, being exclusive to this feature.
Creating a new visual calculation is possible by selecting one of the available templates via the “FX” button:
- Running Sum: allows for cumulative sum using the RUNNINGSUM function with the option to specify a reset parameter when the calculation needs to start over from zero.
- Moving Average: with the MOVINGAVERAGE function, you can specify the window size over which the average should be calculated.
- Percent of parent/Percent of grand total: these two functions calculate the relative percentages with respect to a specified hierarchical scale or compared to all values, using the COLLAPSE and COLLAPSEALL functions.
- Average of children: calculates the average on a set of child values using the EXPAND function.
- Versus previous, Versus next, Versus first, and Versus last: used for comparing values using the PREVIOUS, NEXT, FIRST, and LAST functions.
Some of these functions, such as Percent of Parent or Percent of Grand Total, require specifying the axis parameter to choose the direction the calculation should follow within the visual matrix. The options consist of:
- Rows: the calculation is performed top to bottom, row by row.
- Columns: the calculation is performed horizontally across columns from left to right.
- Row Columns: the calculation is first performed top to bottom among rows and then column by column from left to right.
- Columns Rows: the calculation is first performed horizontally across columns and then top down on the rows.
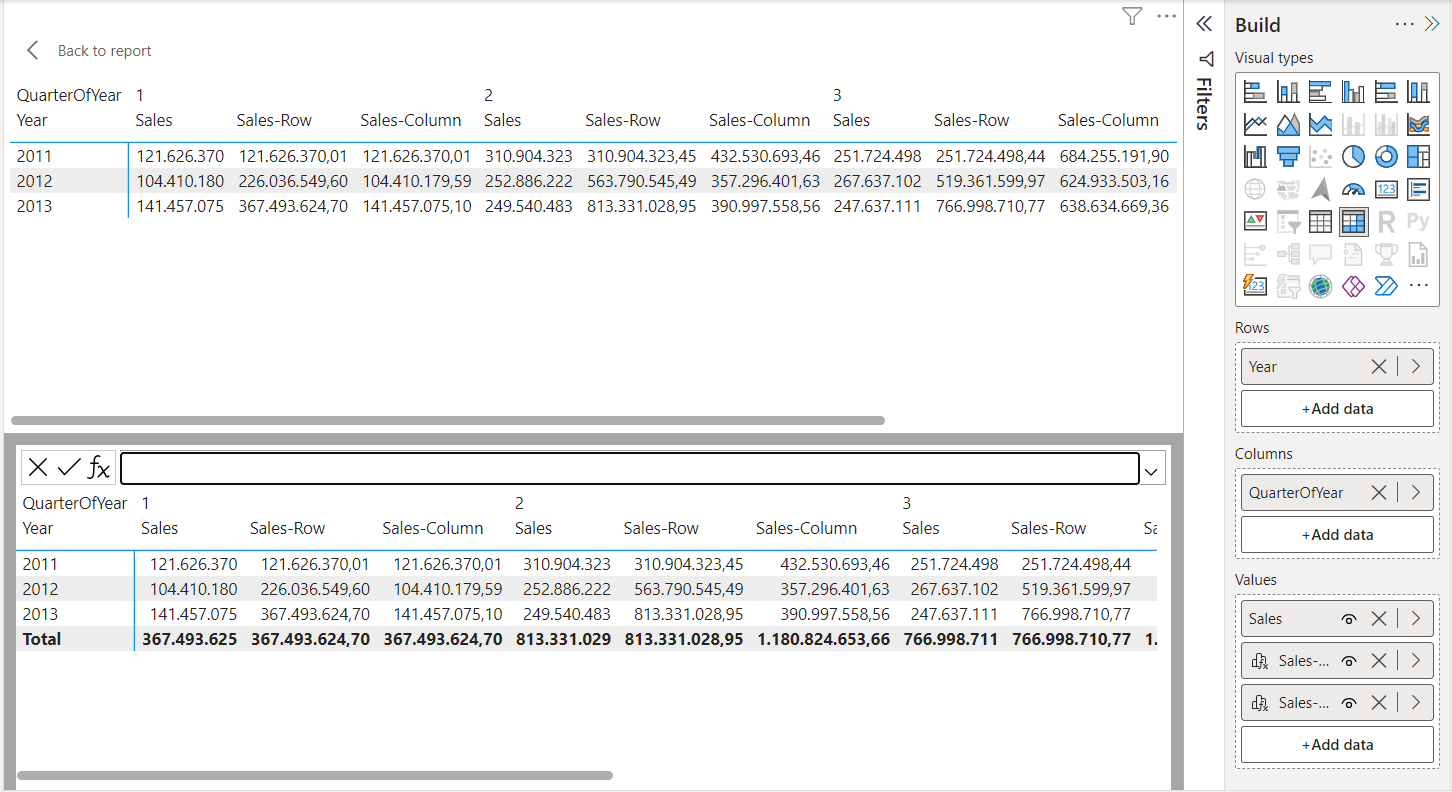
Below is an example where two visual calculations have been created. The first, “Sales-Row,” performs the running sum across the rows, and the second, “Sales-Column,” does the same across columns from left to right.
In addition to the axis parameter, there’s another useful parameter to specify when a visual calculation needs to reset to zero, as might be the case with a Running Sum. This is called the reset parameter and can only be used if multiple dimensional levels are present on an axis. If not specified differently in the template, the calculation would not automatically reset. Therefore, whenever we want to define a different calculation setup from the default one, as the second parameter of RUNNINGSUM, we can indicate one of two values: HIGHESTPARENT or LOWESTPARENT.
To understand these two concepts, let’s consider a practical example with a hierarchy composed of Year, Quarter, and Month. In this case, if we decide to do a RUNNINGSUM that resets every Quarter, then we would specify the value of LOWESTPARENT. Conversely, if we want a running sum that aggregates by Year, then we would specify the value of HIGHESTPARENT.
In the case of a hierarchy with more than three hierarchical levels, we can specify the reset parameter with numbers. This means that in the aforementioned case, the equivalent of HIGHESTPARENT would be 1, and for LOWESTPARENT, it would be 2, continuing in this manner down to the last level of hierarchy.
As shown in the figure, the visual calculation “Running sum HP” resets every year, while the “Running sum LP” resets every quarter.
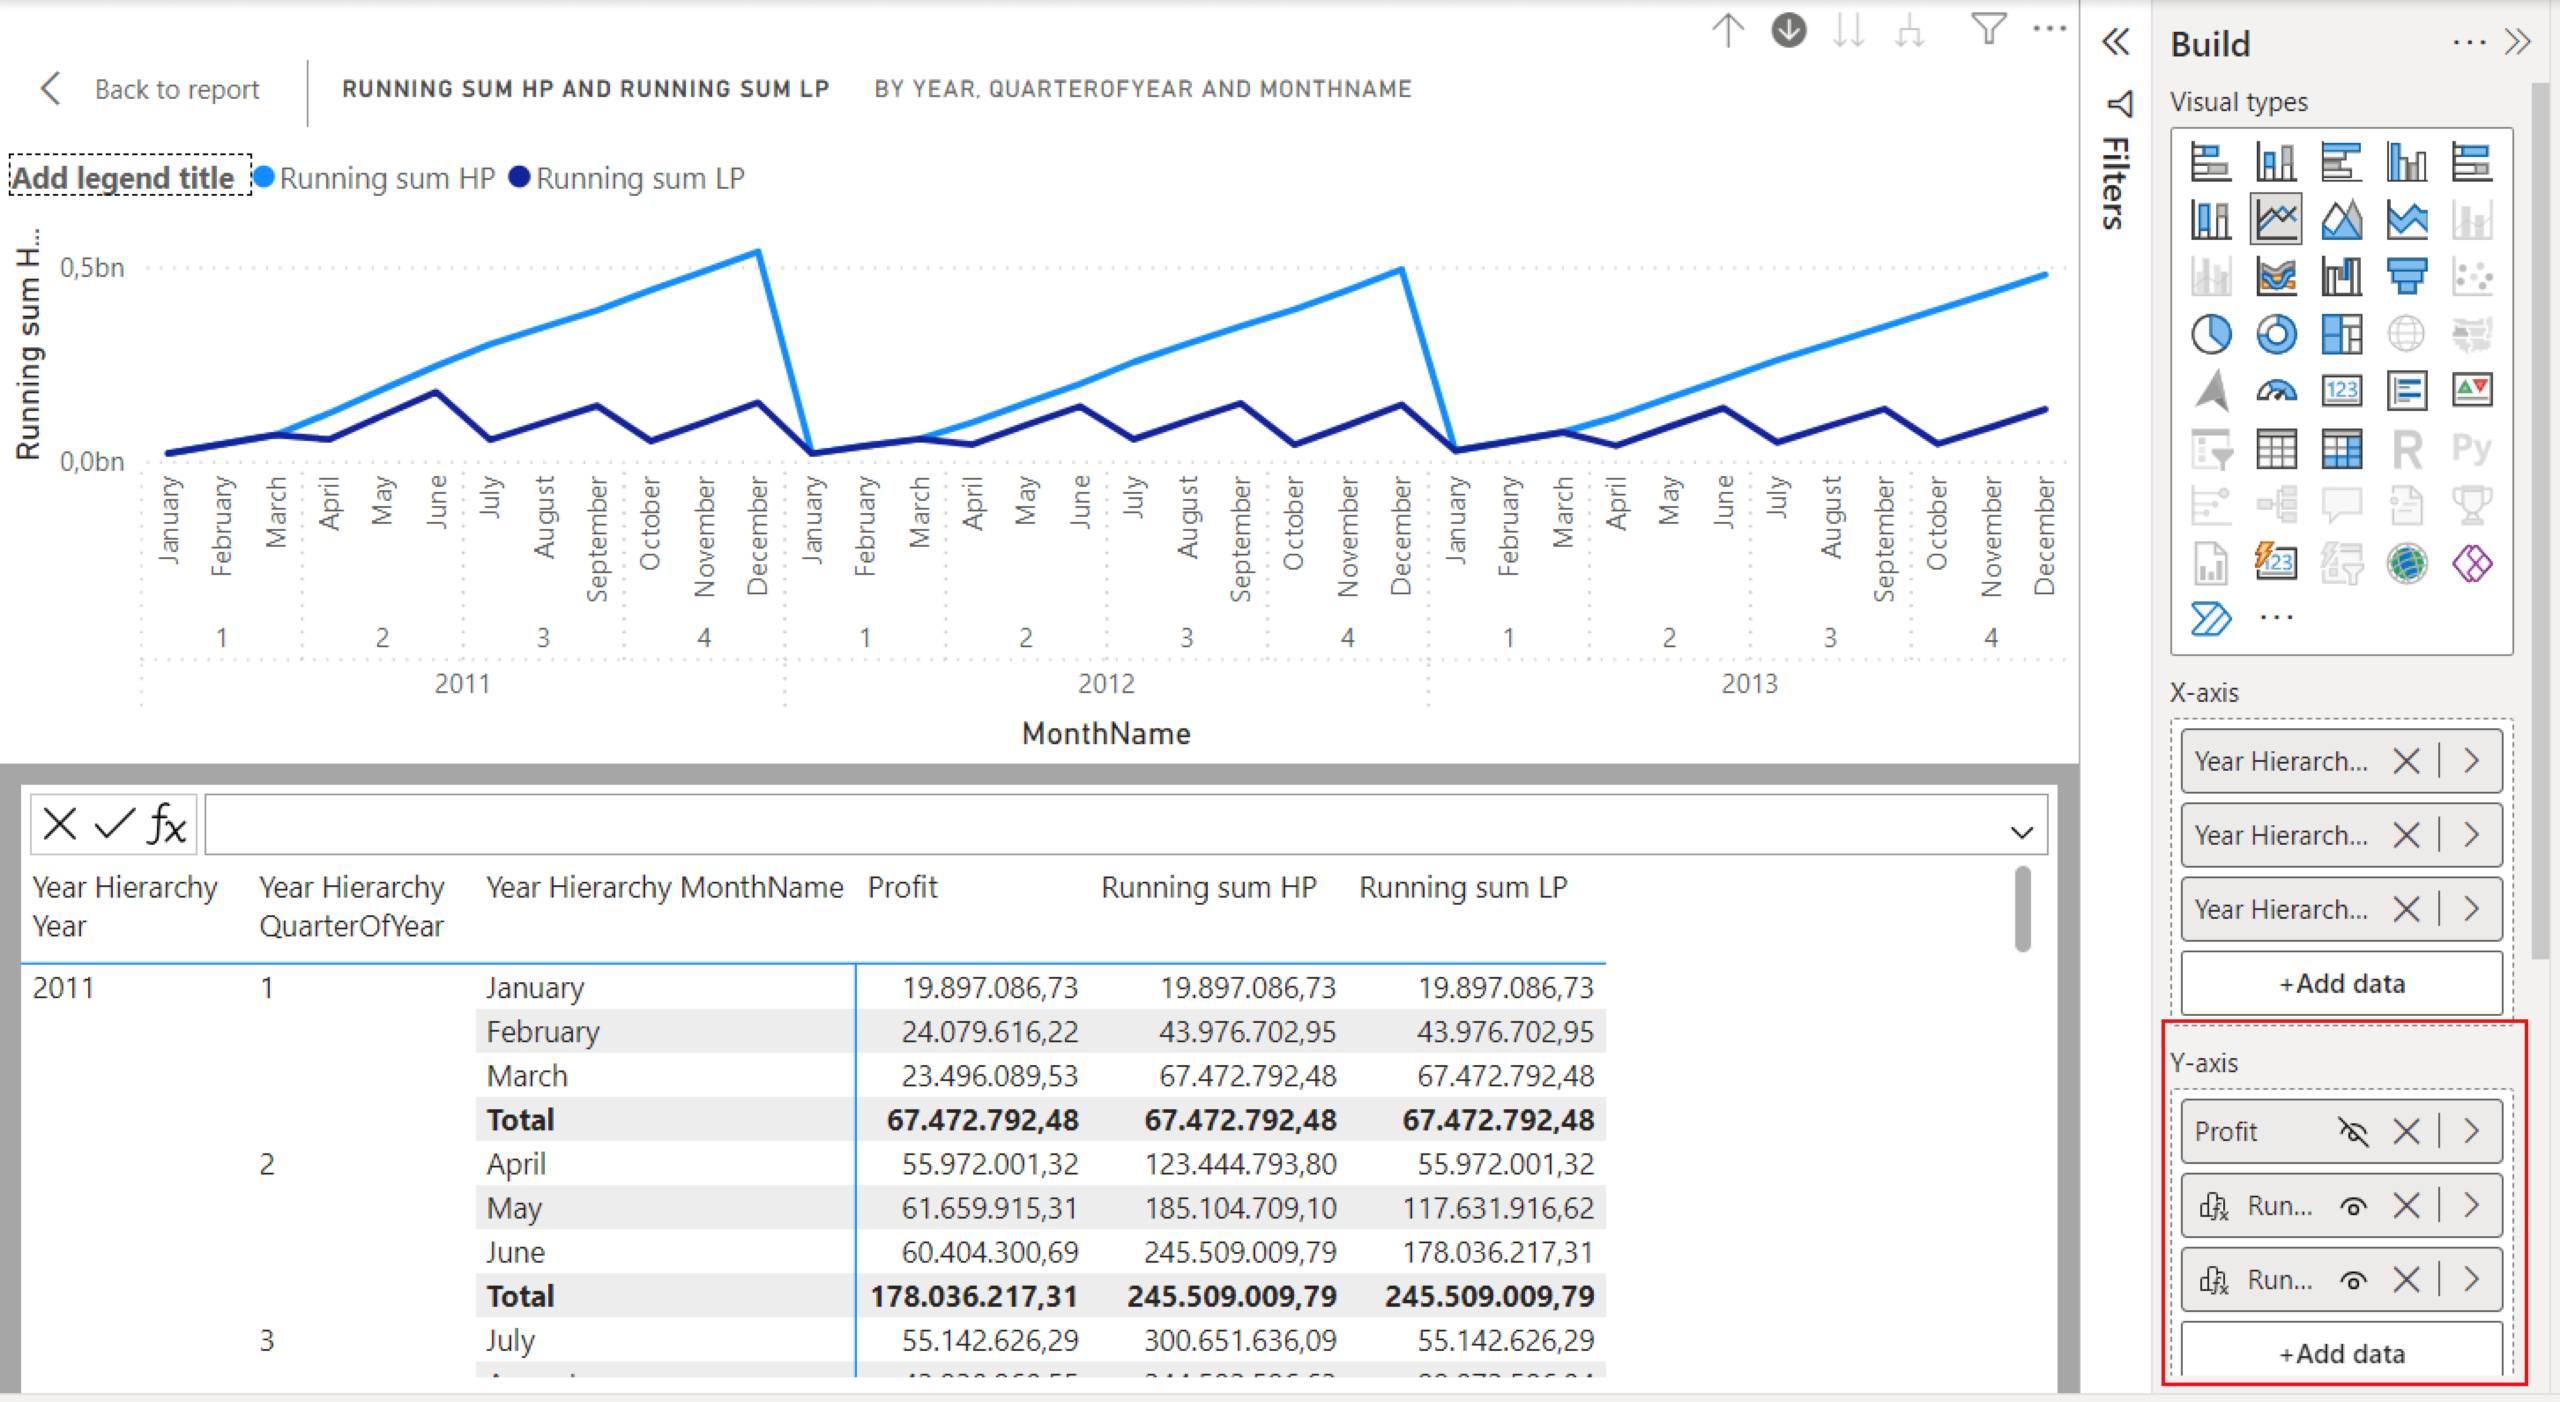
Additionally, in the red panel, it is noticeable that, if necessary, there is also the option to hide fields that are not needed. In this case, only the Running Sums can be left visible, even though they both rely on the profit field which is no longer visible.
Conclusions
Although visual calculations offer a valid solution to simplify certain calculations and provide performance benefits, as discussed above, they have some limitations. Among these are the inability to use numeric parameters and field parameters within them, as well as their inapplicability in the fields of conditional formatting. Furthermore, they do not inherit formatting from the source measures, necessitating the use of the FORMAT function to specify their format.
Another limitation is the lack of universal support for visual calculations by all visuals; for example, line and stacked bar charts, line and column charts, scatter charts, and maps do not support them. Given that visual calculations are still a feature in preview, it is hoped that future updates may resolve these restrictions. Despite the challenges, this innovation represents a significant advancement in the usability of PowerBI Desktop, pushing further towards the concept of self-service BI.
Learn to create your Dashboards with Power BI
To learn how to create your own dashboards with Power BI and connect to data sources to build impactful interactive dashboards, sign up for our course.

Visualitics Team
Questo articolo è stato scritto e redatto da uno dei nostri consulenti.
Condividi ora sui tuoi canali social o via email: