Tableau extensions: what are they?

Have you ever tried to build a complex visualization like a Sankey chart or Radar chart on Tableau? It can be time-consuming and not at all trivial. Fortunately, since version 2018.2 Tableau has introduced Dashboard Extensions that will help you solve challenges like these. What are Tableau Extensions? Dashboard Extensions are small web applications (like […]
Forecasting in Tableau Desktop: Part 1

Starting today, our new column dedicated to forecasting in Tableau Desktop. Did you know that it is possible to make real forecasts on our data? If the answer is no, we hope to provide you with an additional tool that can give more value to your analysis! Our journey will touch on several topics: the […]
Gamification and Big Data Analysis: an innovative point of view

We said it in a previous article: Big Data Analysis can be applied to many fields, first of all within an organization, where it can help to further investigate every kind of behavior and business decision. However, it is not so easy to leverage data properly. The most concrete problem is very often the collection […]
Digital marketing: improve your business with the help of Tableau

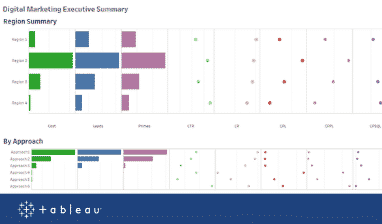
Those who work in marketing, digital or otherwise, know it well: the amount of reporting done every day is immense and, very often, totally diverse. Analyzing sites and their performance, planning and buying media, creating and monitoring content, promoting the brand and developing brand awareness, analyzing the performance of each social campaign: these are just […]
Forecasting in Tableau Desktop: Part 2

Here is the second installment of the column dedicated to Forecasting, or how to be able to forecast data using Tableau Desktop. In this series of articles, we will follow an iter, in which we will see which models Tableau implements by default, how to customize them and how to implement other forecasting models thanks […]
Parameter Actions on Tableau: the best views on the web

Not long ago we told you about how parameters can help us improve our visualizations in Tableau. In addition to the introduction of dynamic parameters introduced in the 2020.1 version, Parameter Actions were introduced some time earlier. As we know, these allow users to modify values within a parameter. In this article we wanted to […]
Explain Data in Tableau Desktop: shed light on your data

TABLEAU Explain Data in Tableau Desktop: shed light on your data With the release of version 2019.3, Tableau Desktop has added a new tool to its already rich list of features: Explain Data. The goal of its introduction is, intuitively, to help Tableau users explain their data. to help Tableau users explain their data. Leveraging […]
Predictive Models in Tableau: New Features

For several versions now, Tableau Desktop provides some tools to predict how the data we are analyzing will behave. We are talking about the Forecast options which we have already discussed in depth in two different articles (part 1 and part 2). With the arrival of the new version 2020.3, Tableau has introduced new features […]
Show Me More Extension in Tableau

When we work with data visualization, we know that it is important to find the most appropriate way to represent the information. We’ve all probably come across spectacular visualizations and maybe tried to reproduce them on Tableau. However, many charts take a lot of time and several steps, sometimes very complex, to build. If we […]
Web Data Connector in Tableau: Facebook

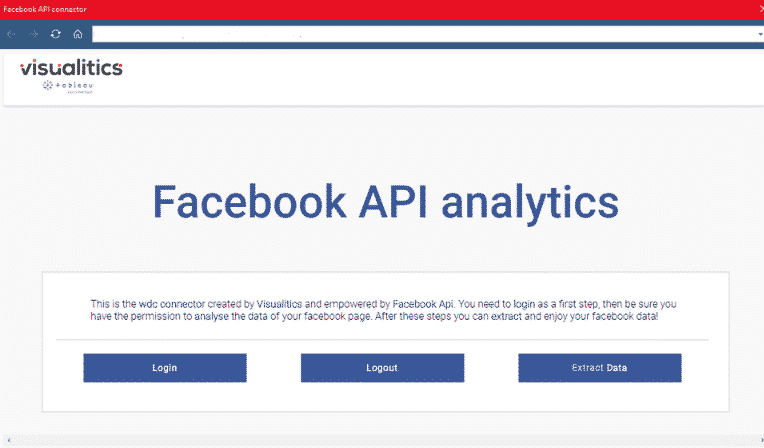
One of the features that makes the difference today when choosing a Business Intelligence tool is its ability to connect to a large number of different data types (here are those available on Tableau today: https://help.tableau.com/current/pro/desktop/it-it/exampleconnections_overview.htm). In addition to traditional connections, Tableau allows its users to create Web Data Connectors (WDCs) to extrapolate data available […]


